
In this review we will look at the short-term strategy “Day Movement”. It is based on identifying and trading a sideways price range (flat) formed before the start of the European trading session.
Description of the “Day Movement” strategy
The “Day Movement” strategy is based solely on technical analysis – it does not use any additional indicators. The main prerequisite for trading this strategy is the presence of a flat. The flat is a sideways price movement without a strict upward or downward direction. Local maximums and minimums of price fluctuations are located at approximately the same level, quotes move within a limited range.
According to the rules of this strategy, it is necessary to wait for a sideways range to form on the chart before the start of the European session. The time of formation of the range – from 18:00 server time (GMT+2) of the previous day till 8:00 am of the current day. If the range is formed, two pending buy and sell orders are placed: Buy Stop and Sell Stop 10 points above and below the limits of this channel, respectively.
In pending orders it is possible to set Stop Loss and Take Profit values immediately or to do it immediately after opening a position. Stop Loss level for a pending buy order (Buy Stop) is set just below the bottom line of the price channel. Stop Loss level for the order to sell (Sell Stop) is established a little bit higher than the upper line of the side channel. The Take Profit is set twice as big as the distance to Stop Loss, but no more than 100 points.
If the price has not reached any of the pending orders by 15:00 (GMT+2), they should be deleted or the expiry time should be set when the order is initially placed. The strategy applies to currency pairs such as EUR/USD, GBP/USD, AUD/USD. The recommended time frame is H1. If the market is currently experiencing a strong trending movement, then this strategy should only be used in the direction of the trend.
The ideal situation to trade on this strategy is when there is a flat on the working timeframe H1 and on the higher D1. If on the upper D1 there is a strong uptrend, it is better to place only a pending Buy Stop order after the sidewall formation on H1. Conversely, if there is a strong downtrend on D1, after a sideways trend is formed on H1, only a Sell Stop pending order may be set.

How to buy using the “Day Movement” strategy
The conditions for opening a buy position:
- On the H1 chart of the currency pair EUR/USD, GBP/USD, AUD/USD a local sideways range (flat) should form. The time of its formation is 18:00-8:00 (GMT+2).
- A pending Buy Stop order is placed 10 points above the top of the range.
- The Stop Loss limit is set beyond the lower limit of the sideways corridor, the Take Profit is set at twice the Stop Loss value.
- If price has not reached the Buy Stop order by 15:00 (GMT+2), it should be deleted or originally set this time for expiry.
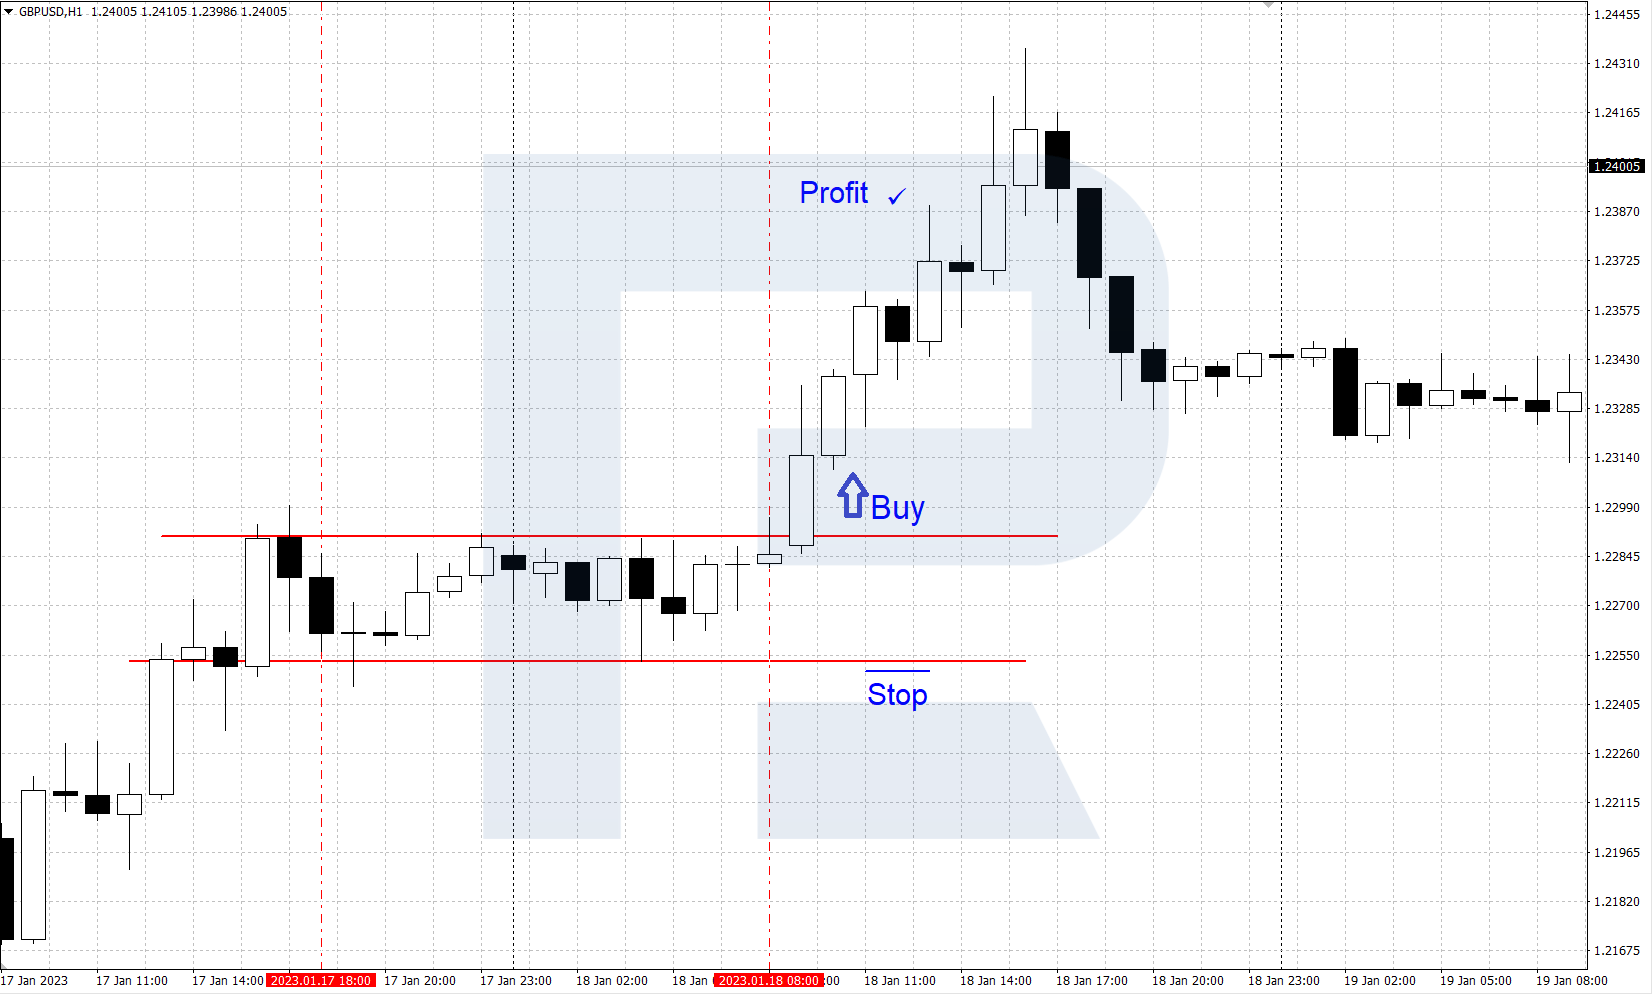
An example of buying by strategy
- On the H1 time frame of the currency pair GBP/USD, a sideways price corridor was formed between 18:00-8:00 (GMT+2) within the time frame set by the strategy, with the boundaries of 1.2253-1.2290.
- A pending Buy Stop order is set 10 points above the top of the price range at 1.2300.
- During the European session, quotations rise, breaching the upper limit of the range. A Buy Stop order is activated and a buy position is opened. Stop Loss is placed beyond the lower limit of the range, Take Profit is set at twice the Stop Loss.
How to sell using the “Day Movement” strategy
The conditions for opening a sell position:
- On the H1 chart of the currency pair EUR/USD, GBP/USD, AUD/USD should form a local sideways range (flat). The time of its formation is 18:00-8:00 (GMT+2).
- A pending Sell Stop sell order is placed 10 points below the lower limit of the range.
- The Stop Loss limit is set just above the upper limit of the sideways range, the Take Profit is set at twice the Stop Loss value.
- If the price did not reach the Sell Stop order before 15:00 (GMT+2), it should be deleted or originally set this time for expiration.
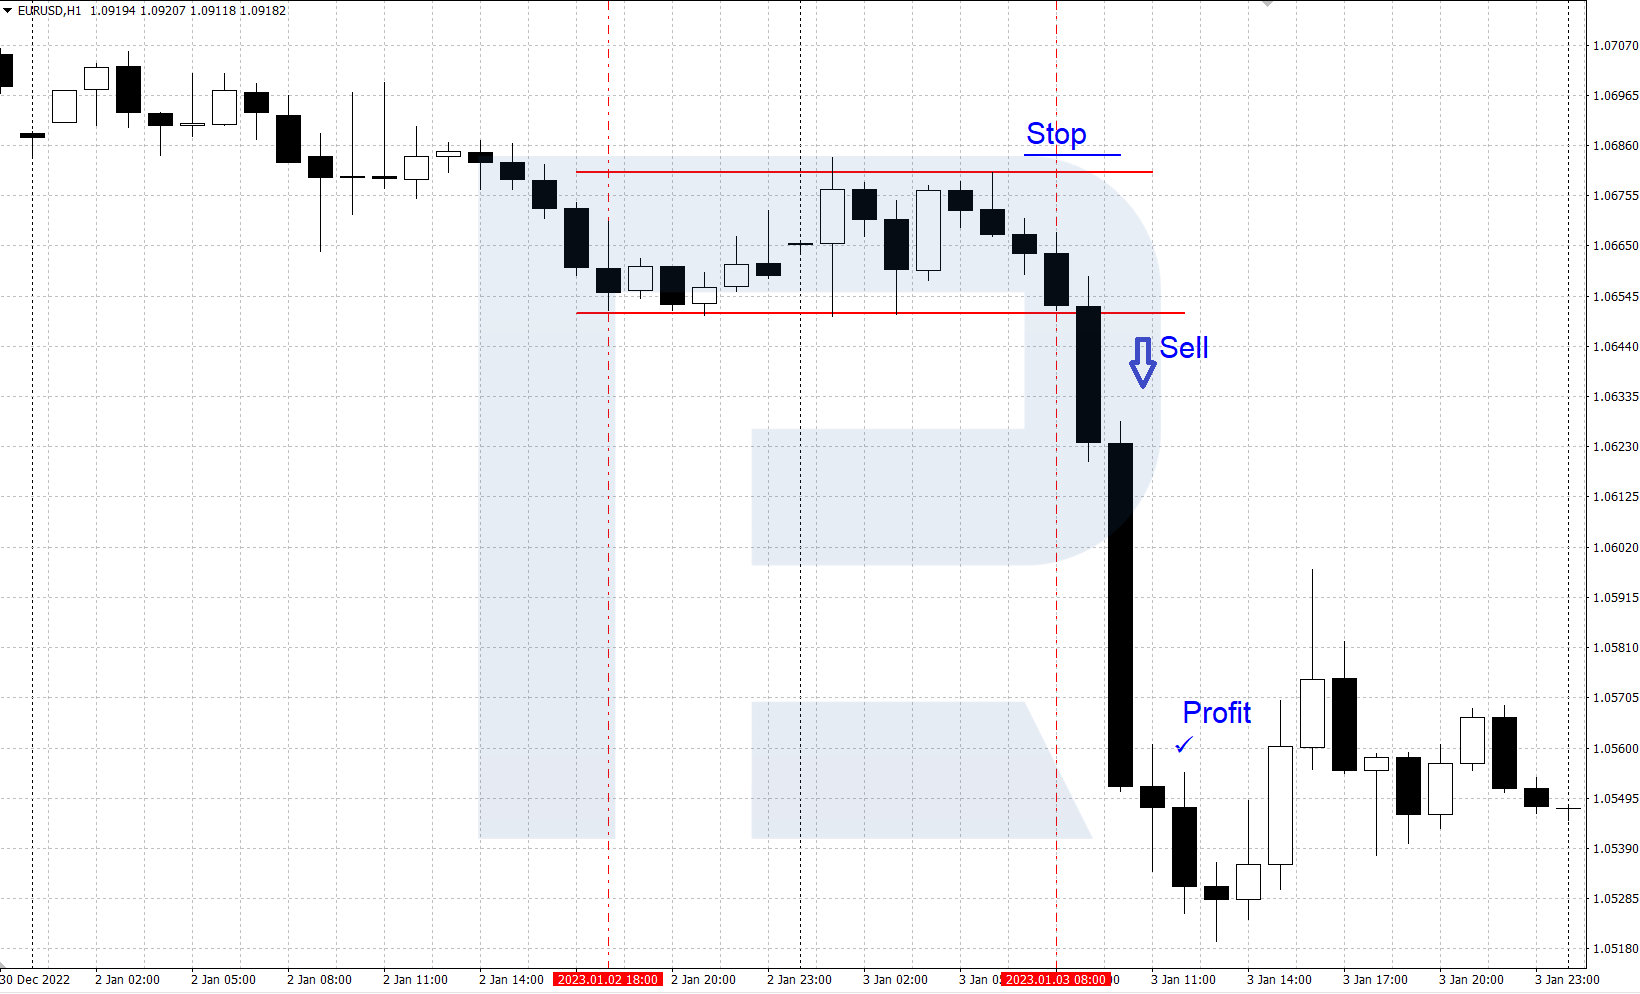
An example of selling by strategy
- On the H1 time frame of the currency pair EUR/USD, a sideways price corridor was formed between 18:00 and 8:00 (GMT+2) within the time frame set by the strategy, with the boundaries of 1.0650-1.0680.
- A pending Sell Stop order is placed 10 points beyond the lower boundary of the price range at 1.0640.
- In the European session, the quotes started to decline, breaking through the lower boundary of the sidewall. A Sell Stop order is activated and a sell position is opened. Stop Loss is placed over the upper limit of the range, Take Profit is set 2 times higher than Stop Loss.
Conclusion
The Day Movement trading strategy is based on breaking through a sideways trading range (flat) formed before the start of the European trading session. It is a short-term and fairly easy-to-use strategy, but market entries do not occur very often (1-3 trades per week), so the trader will need to be patient. It is recommended to test this strategy on historical data and in real time using a demo account before using it in real trading.
The post How to Trade the “Day Movement” Strategy appeared first at R Blog – RoboForex.