There are eight currencies in the world, recommended by the International Monetary Fund (IMF) for storing gold reserves. They would be:
- USD – US dollar
- EUR – euro
- GBP – Great Britain pound
- AUD – Australian dollar
- NZD – New Zealand dollar
- CAD – Canadian dollar
- CHF – Swiss franc
- JPY – Japanese yen.
The pairs constituted by 7 main currencies against the US dollar are called majors: EUR/USD, GBP/USD, AUD/USD, NZD/USD, USD/CAD, USD/JPY, USD/CHF.
All other pairs traded in Forex that do not include the USD are called cross-rates.
Majors make up for 70% of all daily turnover in Forex; cross-rates make up for the remaining 30%. While among majors, the most widely used is EUR/USD, among cross-rates, EUR/GBP is the most popular one.
This article is devoted to this currency pair, its history and peculiarities, and trading strategies that suit it.
Short history of EUR/GBP
The EUR/GBP pair appeared right after the European Union was formed because it was necessary to establish trade relations between the two largest economies in Europe. Britain entered the EU in 1998, keeping its own currency and credit and monetary policy.
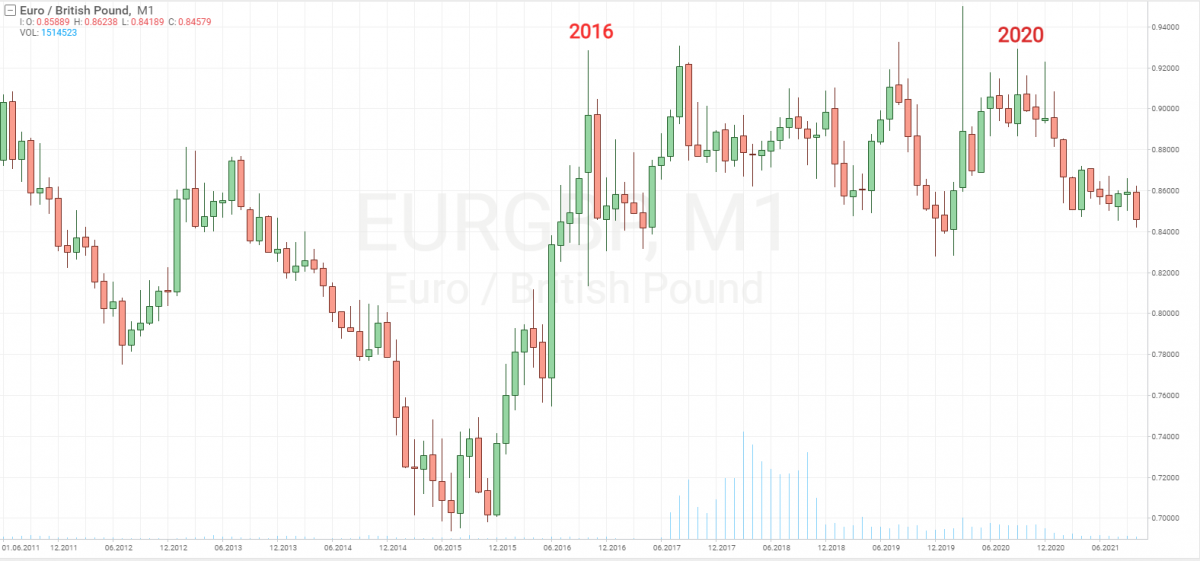
In 2016, the country decided to exit the EU. Brexit, which used to be the main source of talks before the coronavirus, came into force in 2020. Naturally, such dramatic changes affected the cross-rate of EUR/GBP.
On MN, we can see an uptrend coming to an end in 2016 and a consolidation range form at this high until 2020. After Britain signed an agreement about its final exit from the EU, the quotations started a new wave of decline.
What influences EUR/GBP quotations
EUR/GBP is neutral to the US economy and performs no stunts characteristic of other pairs when some important news in the USA emerge.
This pair mostly reacts to inflation data in the EU and Britain. Also, check the pair when the ECB and Bank of England change interest rates.
As a rule, cross-rates react to such events by long-term trends. So, before such news emerge, single out a consolidation area and wait for exiting these areas by the trend.
Trading EUR/GBP, you can use several tactics:
- Trading by fundamental analysis
- Trading by tech analysis
- Trading by indicators.
How to trade EUR/GBP
There are no unique ways of trading this pair. EUR/GBP, as many other instruments, goes well with tech analysis and indicators, as well as has a set of fundamental factors that have the brightest influence on the pair.
The general approach to trading this pair can be described as follows:
- Check the charts of the instrument starting from MN and up to M1.
- Draft a plan of work.
- Choose your work time.
- Develop your own trading strategy.
- Test your strategy on a demo account with a tester.
After you get some positive results, start trading on a real account.
I will show you below some clues to designing your own strategy for EUR/GBP.
Using fundamental analysis
Let us see how fundamental analysis works for EUR/GBP.
The main fundamental pieces of news for this cross-rate are:
- Inflation level in the EU and Great Britain
- Interest rates in the EU and Great Britain.
This is what an H1 of the pair looks like at the moment one such piece of news emerges:
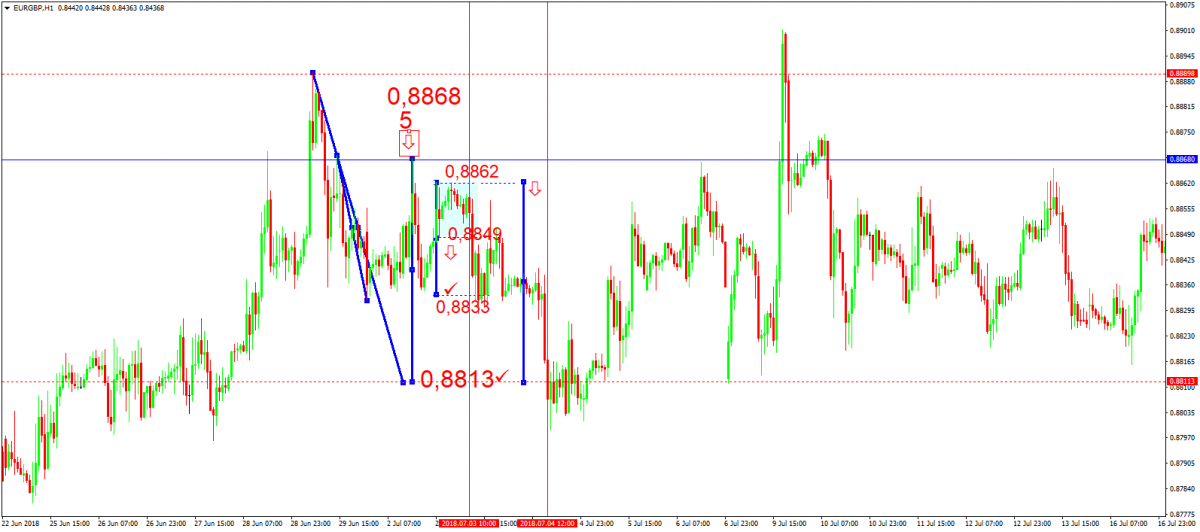
Since March 10th, 2016 the interest rate of the ECB has been 0%, while the BoE has lifted its interest rate by 0.25 base points, thus making it 0.75%. This fundamental event initiated the 5th wave of decline from 0.8868.
The trend of this wave aims at 0.8813. As a rule, before such news come out, the market forms a consolidation range. This pair formed it between 0.8862 and 0.8849.
On the chart, we can see the market break through the lower border of the range and declined by its width.
This piece of news also pushed down the trend of the fifth declining wave to 0.8813. The wave was reached just overnight.
Using tech analysis
Now let me show you how to use the pair with tech analysis.
Take a look at the EUR/GBP D1 chart:
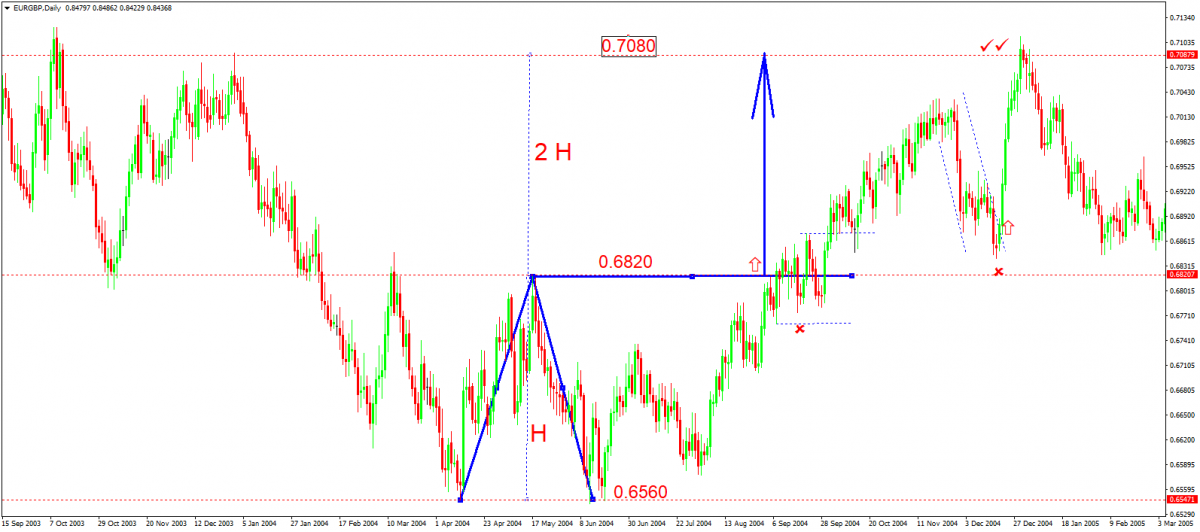
In 2004, there formed a classic tech pattern Double Bottom on the chart. With a breakaway of the top of such a pattern at H=0.6820, the market, as a rule, reaches the high of 2H=0.7080.
You can use a breakaway of 0.6820 for opening long positions and close them at 0.7080. On your way you can increase your volumes after the correction ends at 0.6880. Your potential profit in such a trade could amount to 4,600 points.
Such an approach can be used for creating your own trading strategy.
Using classic indicators
To sum up, try using classic indicators – MACD and Parabolic.
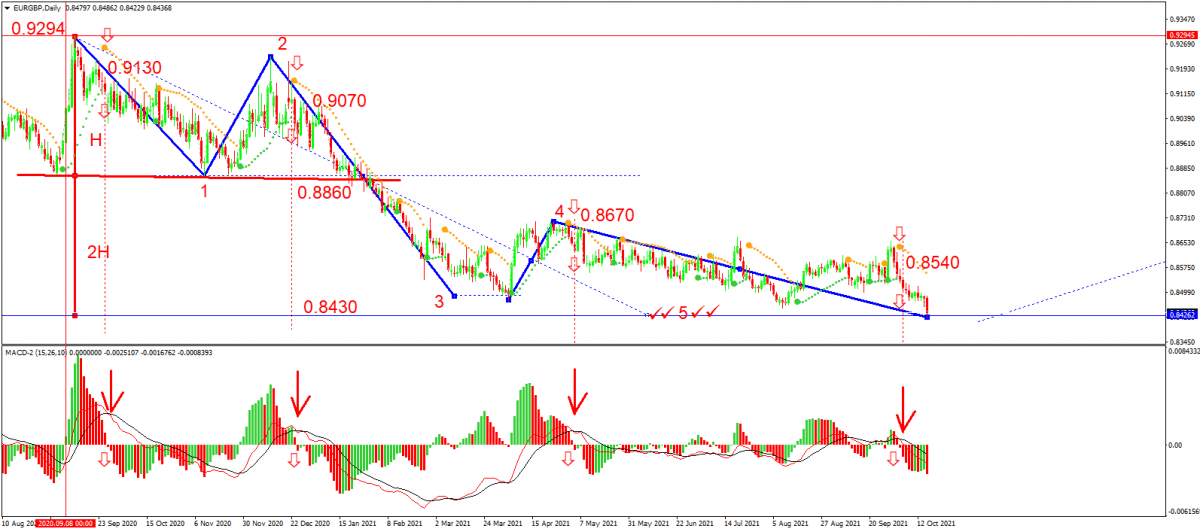
In September 2020, the market finished a wave of growth and started developing a new downtrend. On the chart, you can see a classic Head and Shoulders pattern.
With a breakaway of 0.8860, the market made a move for 2H=0.8430. Potential profit from such a pattern might be 420 points. If you used MACD and Parabolic in addition to your analysis, you could increase the number of positions to 4:
- 0.9130 for selling. SL above 0.9250
- 0.9070 for selling. SL above 0.9150
- 0.8670, SL above 0.8750
- 0.8540, SL above 0.8640.
At 0.8430, you could make a profit of 1.680 points.
Closing thoughts
For trading EUR/GBP, you can use various instruments: fundamental analysis, tech analysis, or indicators. The clue is to know how to use them all. Check out our blog for more information.
Also, stick to your money management and risk management rules, learn key aspects of trading psychology. All this will help you understand Forex better and work more efficiently.
Start trading on a demo account and switch to a real one after you practice a lot.
Good luck, all of you!
The post How to Trade EUR/GBP? appeared first at R Blog – RoboForex.
