
This article is a review of a trading strategy based on a combination of moving averages under – “Scalping Strategy with EMA”. Its tactics imply quickly closing profitable positions on minute and five-minute charts. For such active work we need tools with minimal spreads. Every point of profit is important, therefore the major currency pairs EUR/USD, GBP/USD, AUD/USD, USD/CAD are used.
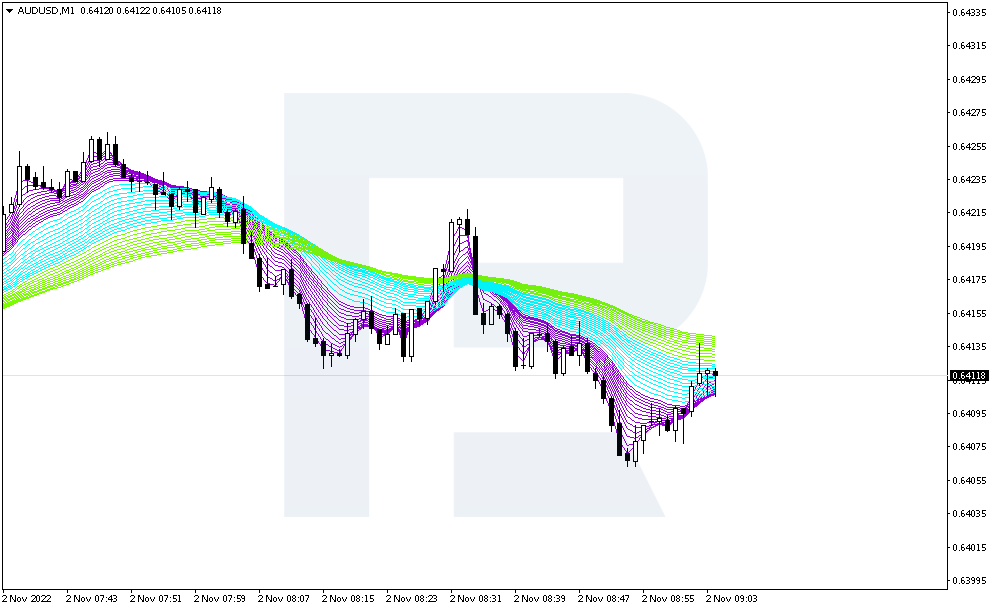
The strategy will clearly show how to combine signals from three moving averages with different periods, the total number of which on the chart will be 38. We will detail the rules for opening positions, adding to the short term trend and closing options.
Adding Scalping Strategy Indicators with EMA
Only EMA indicators with different periods should be added to the chart. Traders usually use this tool to determine the trend on the market – if the price is above the EMA line, then the trend is bullish and a buy is anticipated. If the price is under the EMA line, then it is a bearish trend and you are supposed to sell.
The very crossing of the lines of the indicator will also give a signal to open positions, if the EMA with a smaller period crosses the EMA with a larger period downwards – it is a signal for the development of the downward movement. If there is a crossing of EMA with a smaller period and EMA with a larger period from the bottom upwards – it is a signal for an upward movement.
Often, even a test of the EMA line signals an imminent breakaway from it and the continuation of the existing trend. In our case, 38 lines of the EMA indicator will form support and resistance areas on the chart, the test of which the price will be a signal to open a position.
Now let’s talk about indicator settings:
EMA with periods 2, 3, 4, 5, 6, 7, 8, 9, 10, 11, 12, 13, 14, 15 – choose purple for all lines. These are fast Moving Scales, they will always be as close to the price chart as possible. We may say that they characterize a short-term trend.
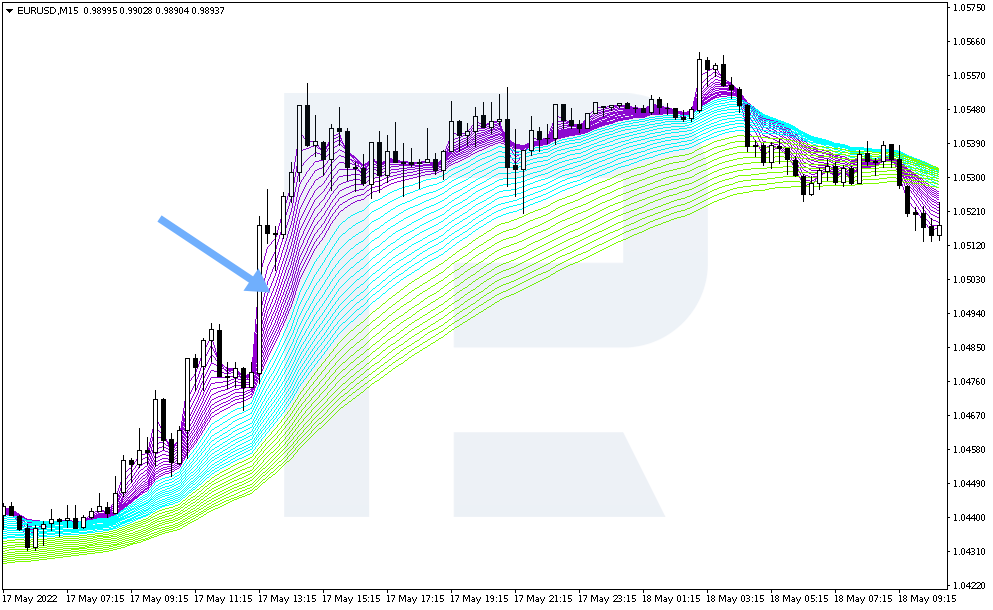
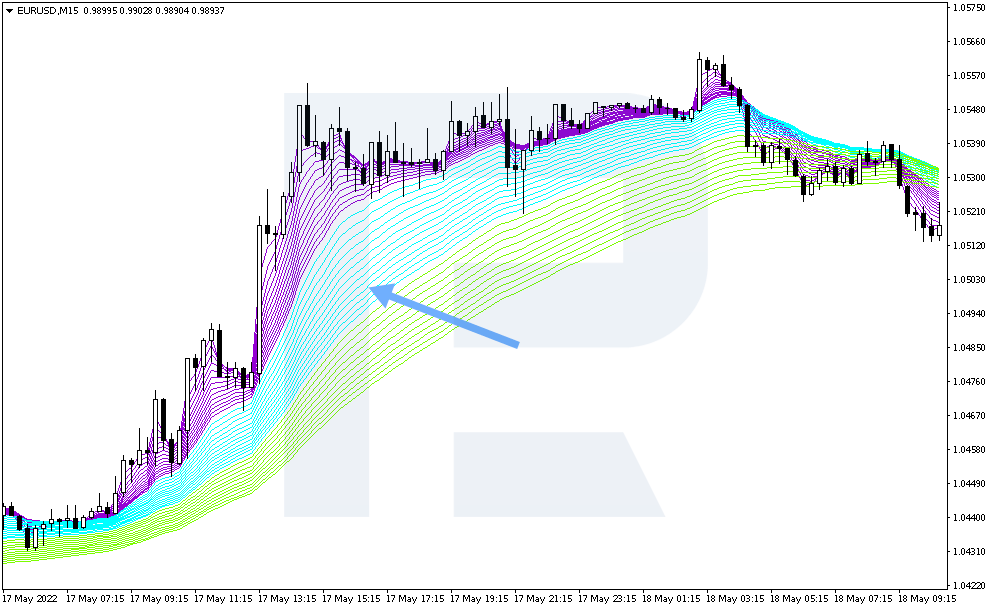
EMAs with periods of 17, 19, 21, 23, 25, 27, 29, 31, 33, 35, 37, 39, 41 – select blue. These lines will be further away from the price chart and characterise the medium term trend.
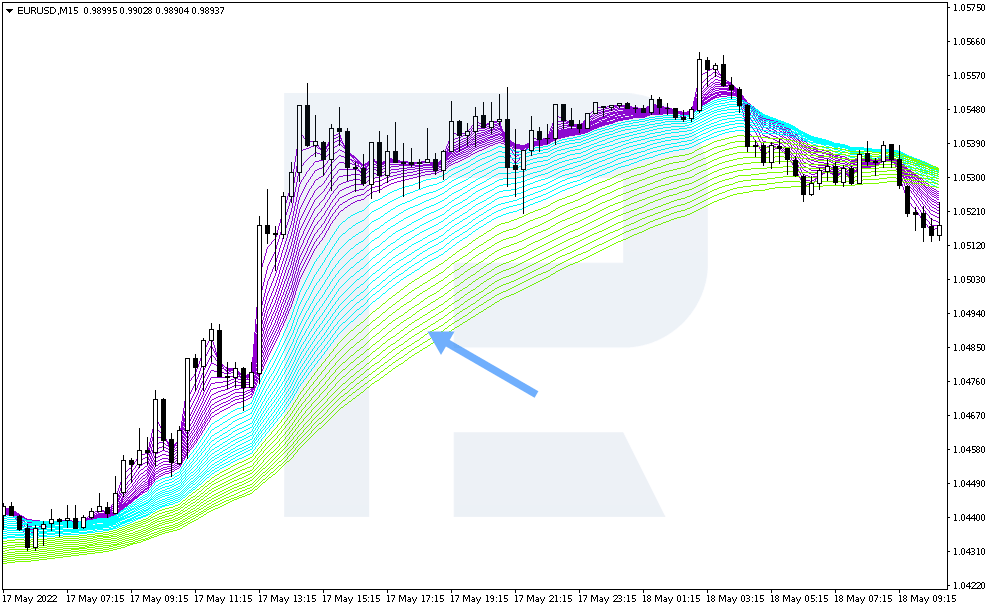
EMA with periods 44, 47, 50, 53, 56, 59, 62, 65, 68, 71, 74 – select green. These lines will be as far away from the price chart as possible and reflect a long-term trend.
How to open a buy position on an EMA scalping strategy
The rules of the strategy imply several options for opening buy positions. For example, if a trend is developing, the tactic allows you to work in the direction of this trend, instead of just entering only at the beginning of its formation. This is a significant advantage of the scalping strategy, because you do not have to wait for the trend to change, just identify the trend and work according to the proposed rules.
Let’s look at the basic rules for opening a long position on the M1 chart:
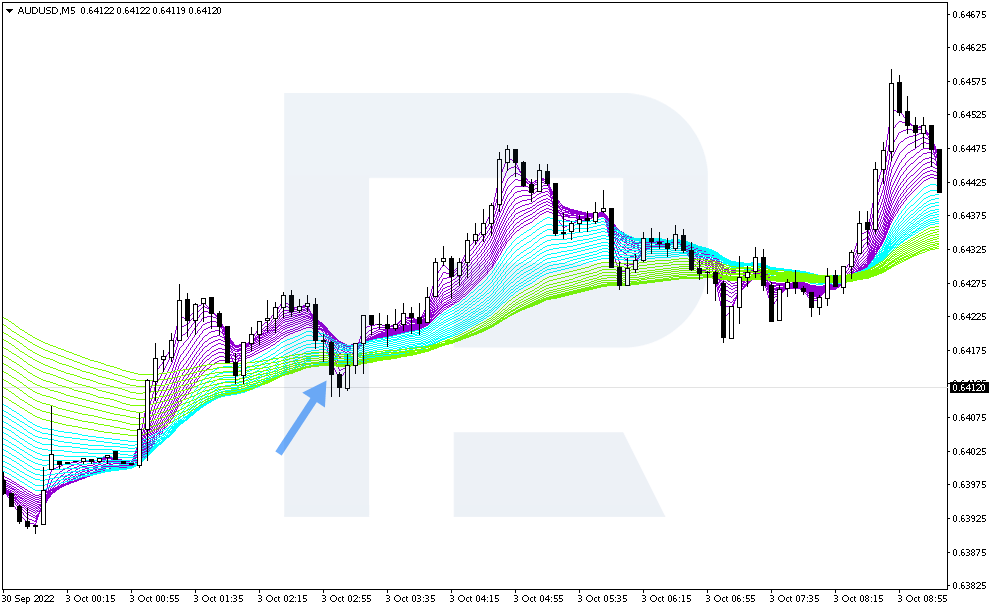
The first long position is opened when the purple EMA lines cross the green EMA lines from top to bottom.
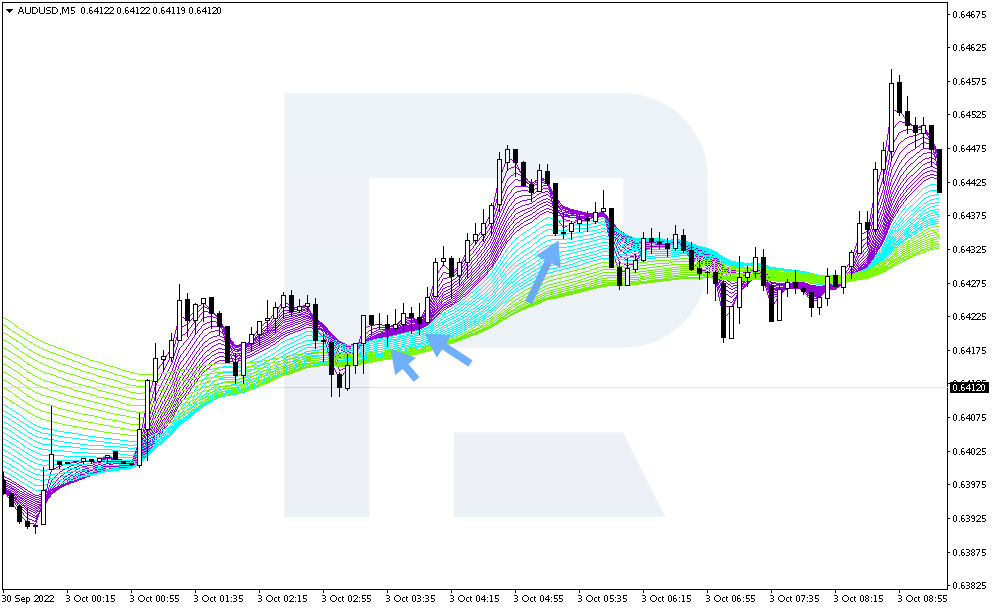
The following long positions are opened when price tests the green or blue EMA lines and returns to the purple indicator lines.
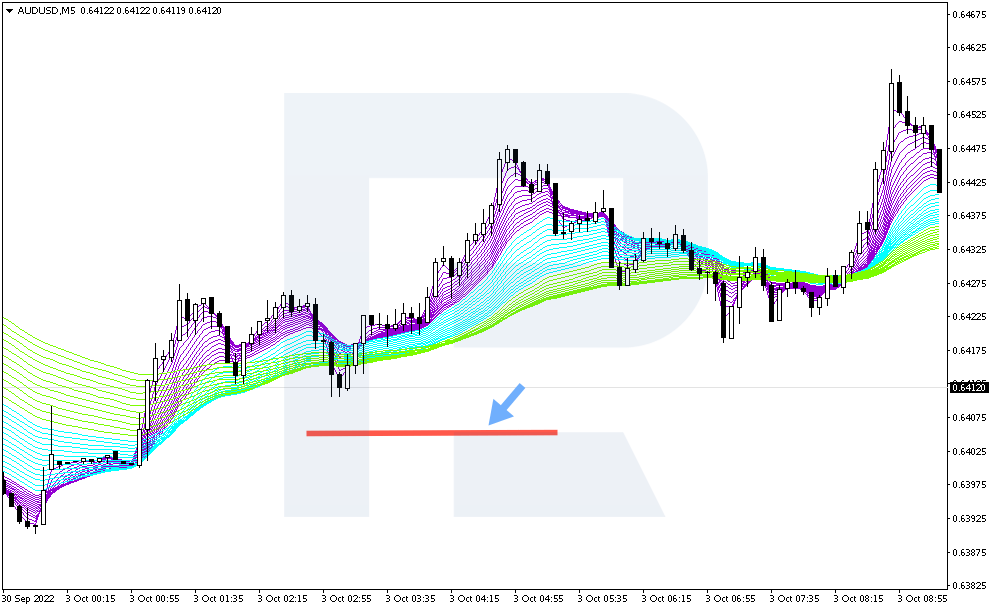
Stop Loss is set 12 points below the entry point.
Take Profit for the first position is set 5-7 points above the entry point.
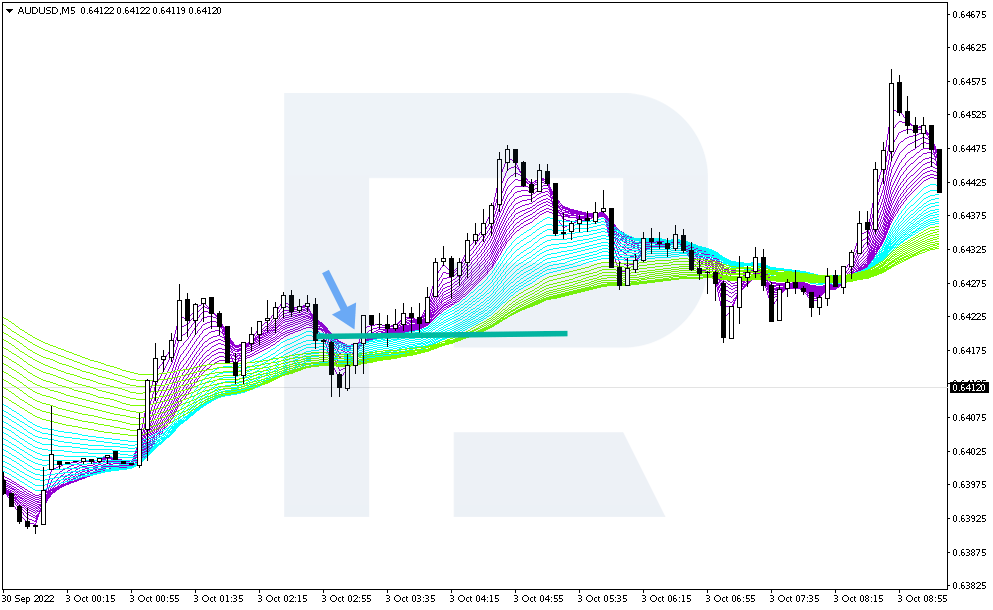
Take Profit for the following positions should be set at 4 points above the entry point.
Rules for setting Stop Loss and Take Profit to open a long position on the M5 chart:
- Stop Loss is set lower by 18 point from the entry point
- Take Profit for the first position is set higher on 12-20 points from the entry point
- Take Profit for the next positions is set higher by 7 points from the entry point
Scalping Strategy Buying Example with EMA
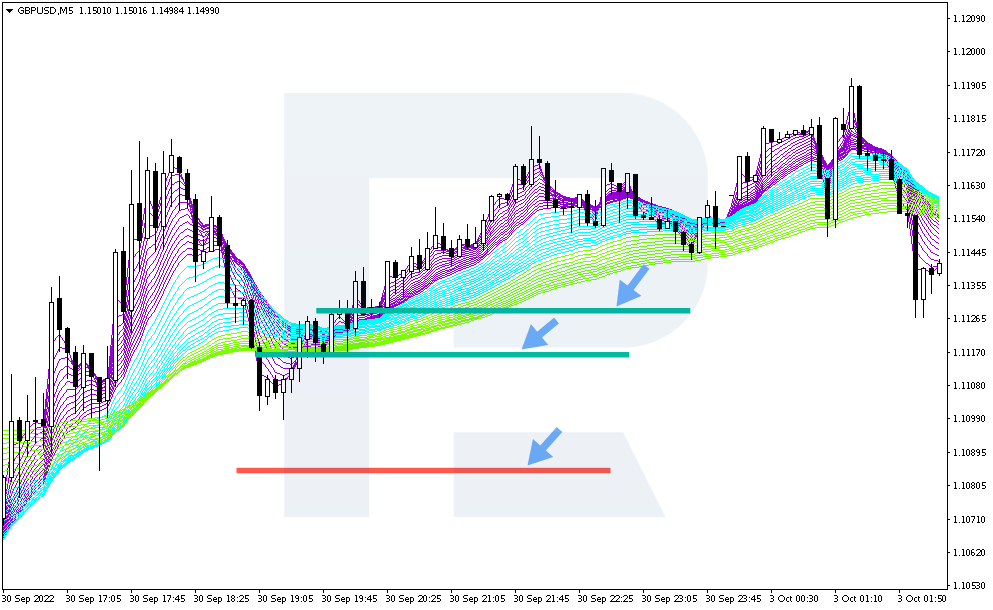
Consider the situation on the GBP/USD currency pair chart from 30.10.2022. The price was moving in a bullish momentum and at some point there was a drop and a breakdown of the purple EMA lines of the green line from above downwards. This is a signal to open a long position. The crossing of the lines will be visible when the candlestick closes and when a new candlestick is formed, a buy position can be opened.
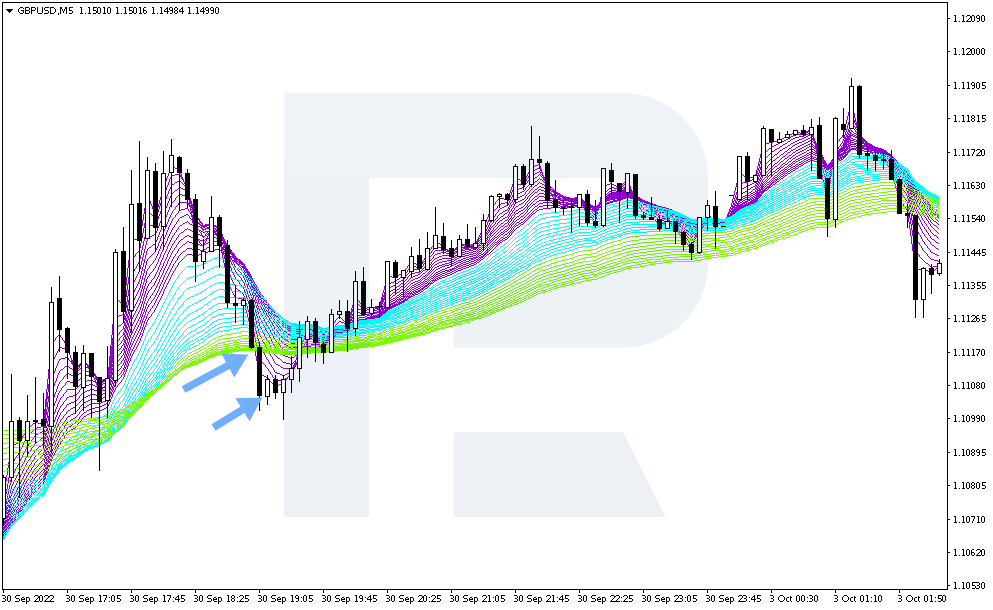
Price has started to move up after a slight fluctuation. You can open a position at 19:10 at 1.1105. Stop Loss is set at 1.1087. The price went down from the entry point by almost 6 points. Take Profit is set at 12 to 20 points , so the first profit will be at 1.1117. The price will reach this point within 20 minutes, and the maximum profit of 20 points will be taken within 40 minutes.
How to open a sell position on a Scalping Strategy with EMA
Let’s look at the rules for opening a short position on the M1 chart:
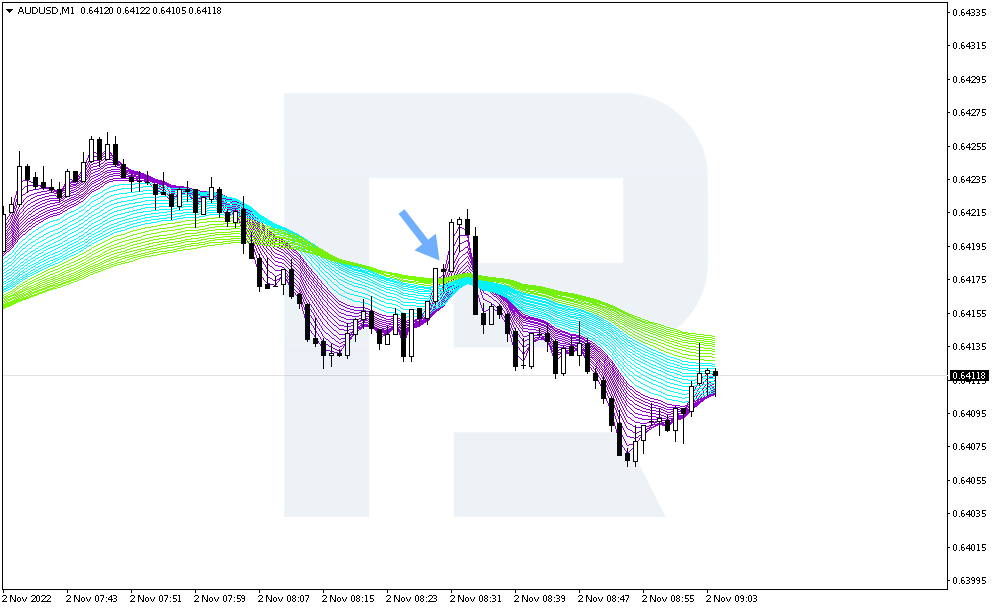
The first short position is opened when the pink EMA lines cross the green EMA lines from below to above.
The following short positions are opened when the price tests the green or blue EMA lines and returns to the pink indicator lines.
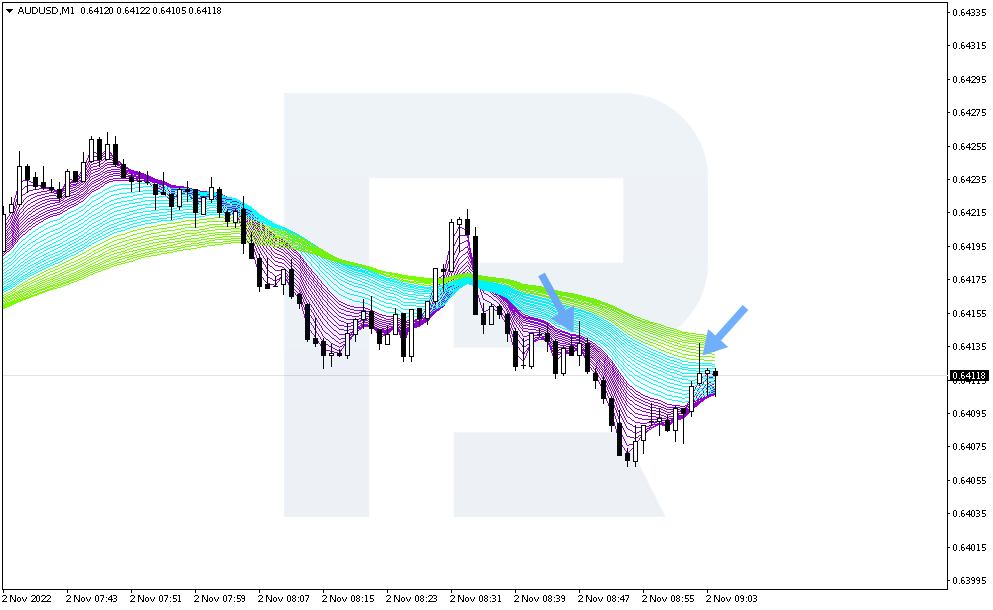
Stop Loss is set at 12 points above the entry point.
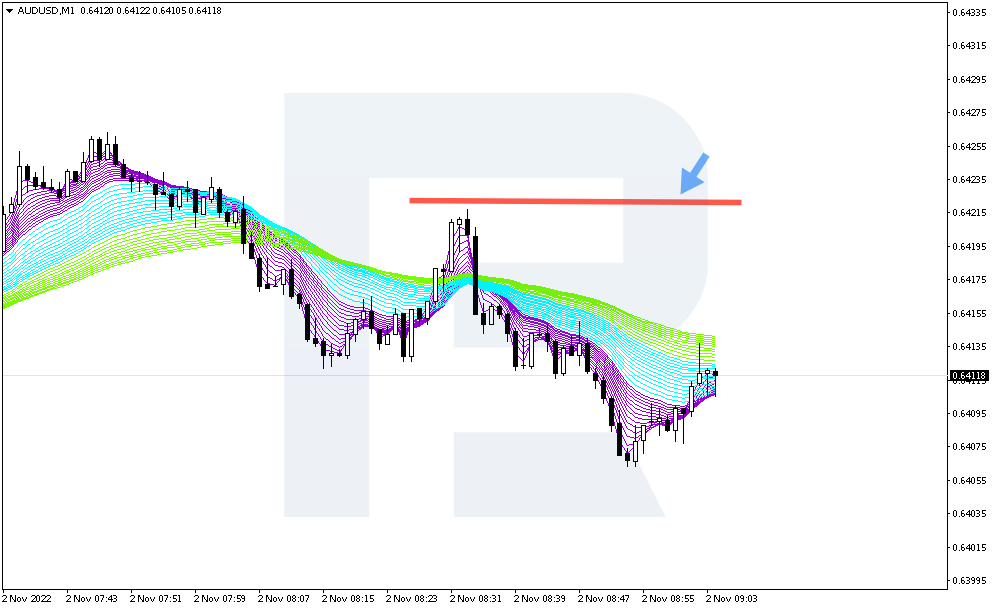
Take Profit for the first position – 5-7 points below the entry point.
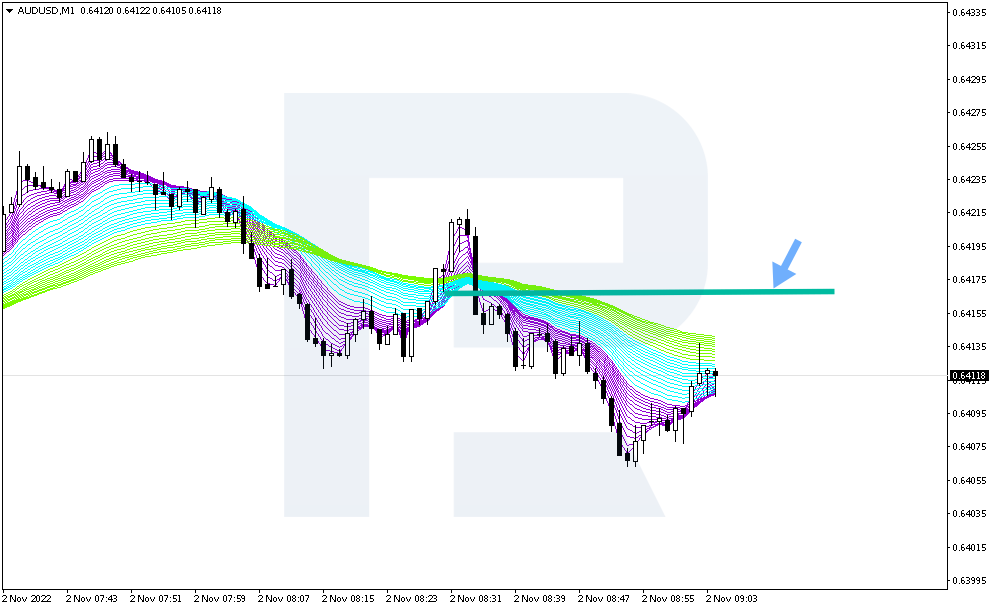
Take Profit for the following positions shall be set 4 points below the entry point.
Rules for setting Stop Loss and Take Profit to open a short position on the M5 chart:
- Stop Loss is set 18 points higher from the entry point
- Take Profit for the first position is set lower on 12-20 points from the entry point
- Take Profit for the next positions is set lower by 7 points from the entry point
Example of a Sell Scalping Strategy with EMA
Consider the situation on the EUR/USD currency pair chart from 02.11.2022. After a slight fall, the price started to rise. Then the purple EMA line was pierced by the green line from the bottom upwards. This is a signal to open a short position. The crossing of the lines will be visible when the candlestick closes, and with the formation of a new candlestick, a sell position is expected to open.
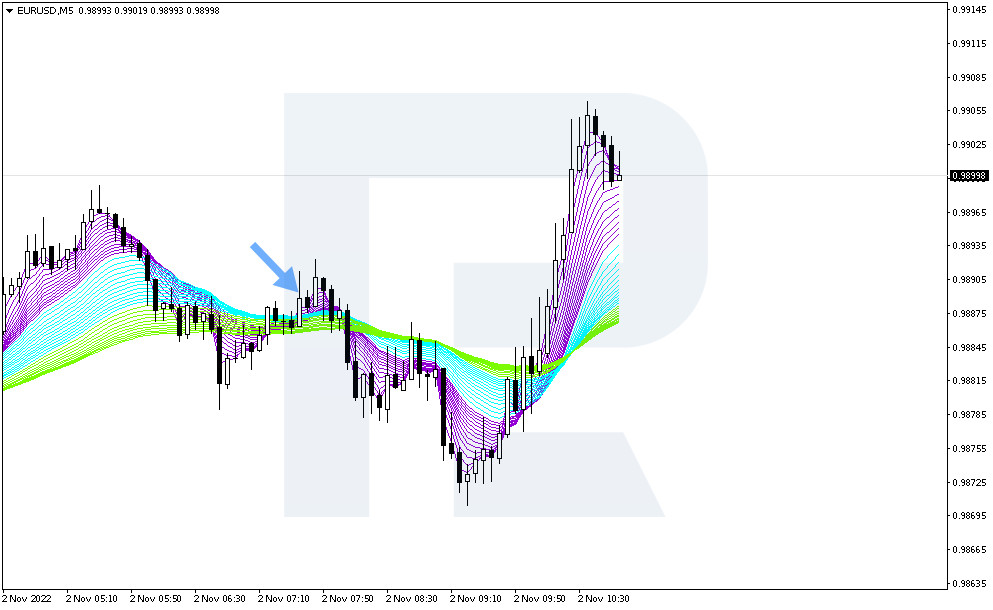
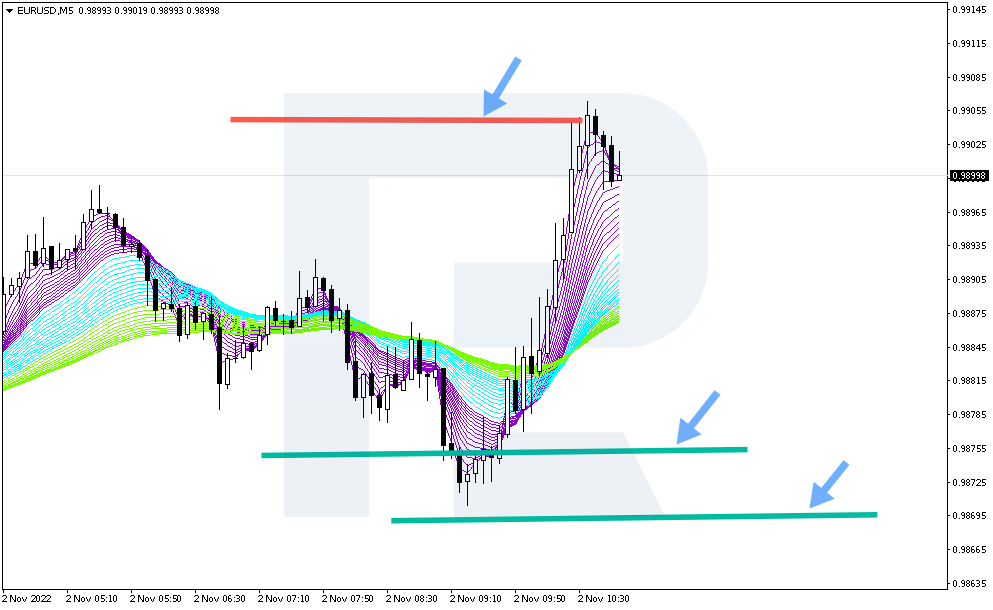
It is recommended to open a position at 07:40 at 0.9888. Stop Loss is set at 0.9905. The price went up from the entry point by almost 4 points. Take Profit is set lower by 12-20 points. The first close of the position with profit will be at the level of 0.9875. The price reached this level in 85 minutes. A position with a profit of 20 points was not closed because the price reversed upwards.
Conclusion
The EMA scalping strategy is a unique tactic where 38 indicators are used at once. The entry rules are quite simple, although they differ from the usual use of moving averages. In this strategy, a sell position is opened when the fast EMA crosses the slow one from the bottom upwards. A buy position is opened when the fast one crosses the slow one from above downwards.
The strategy also provides an opportunity to work in the direction of the prevailing trend, which is a significant plus, because there is no need to wait for a trend change to open positions. On the downside, it should be noted that the size of the Stop Loss is somewhat disappointing, as it turns out to be larger than Take Profit, which is not always right from the risk management point of view.
The post Scalping Strategy with EMA appeared first at R Blog – RoboForex.
