You must have heard about traps for bulls and bears appearing on charts. This article tries to get into more detail of the issue, telling you how to detect places of such traps and how to avoid them.
What are traps for bulls/bears
A bullish/bearish trap is a chart situation when the quotes pretend to break through an important price level and then reverse sharply and go in the opposite direction. As such an important level, we can see support/resistance levels, trend lines, or graphic patterns. Bullish/bearish traps are frequent in financial markets.
The idea is that traders open their positions by formed price signals by the current price movement. However, for various reasons, the opposite side turns out much stronger and suddenly reverses the price in the opposite direction.
This makes traders panic and close initial positions, which only enhances the opposite movement. In other words, bulls or bears get trapped and close their positions at a sudden price reversal, thus supporting the movement in the opposite direction.
How to detect traps for bulls
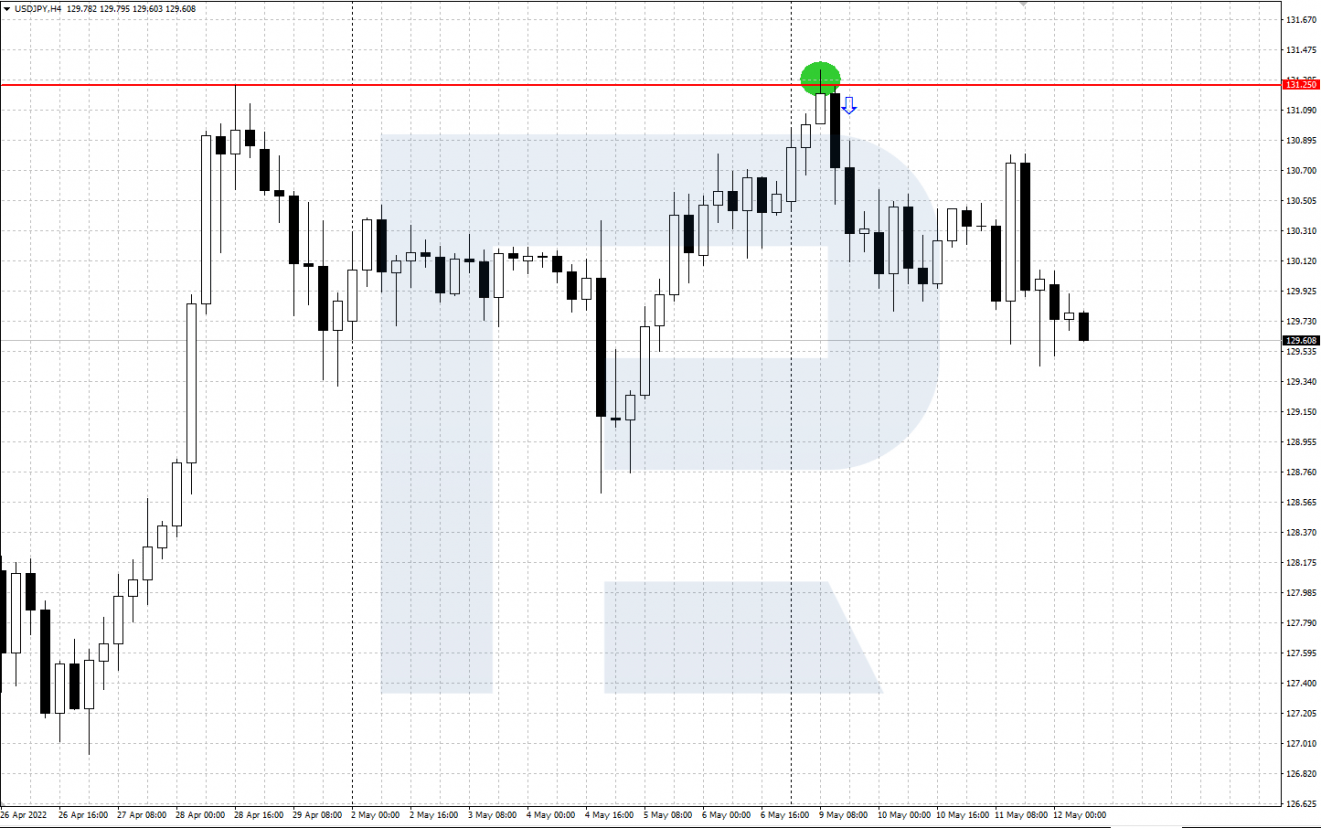
Most often, bullish traps rest near important resistance levels that have already been tested by the price. The price seems to break through such a level upwards, and bulls open long positions, expecting the price to keep growing. However, it reverses and goes down.
The sign that the trap has been triggered is the return of the price to the area below the broken resistance level. Bulls are playing long and have to make decisions about closing their trades.
Reversing the quotes down, bears have proved their power and readiness to fight back. Bulls start closing their buying trades, Stop Losses get triggered, so the downward momentum gets stronger, and the trap locks.

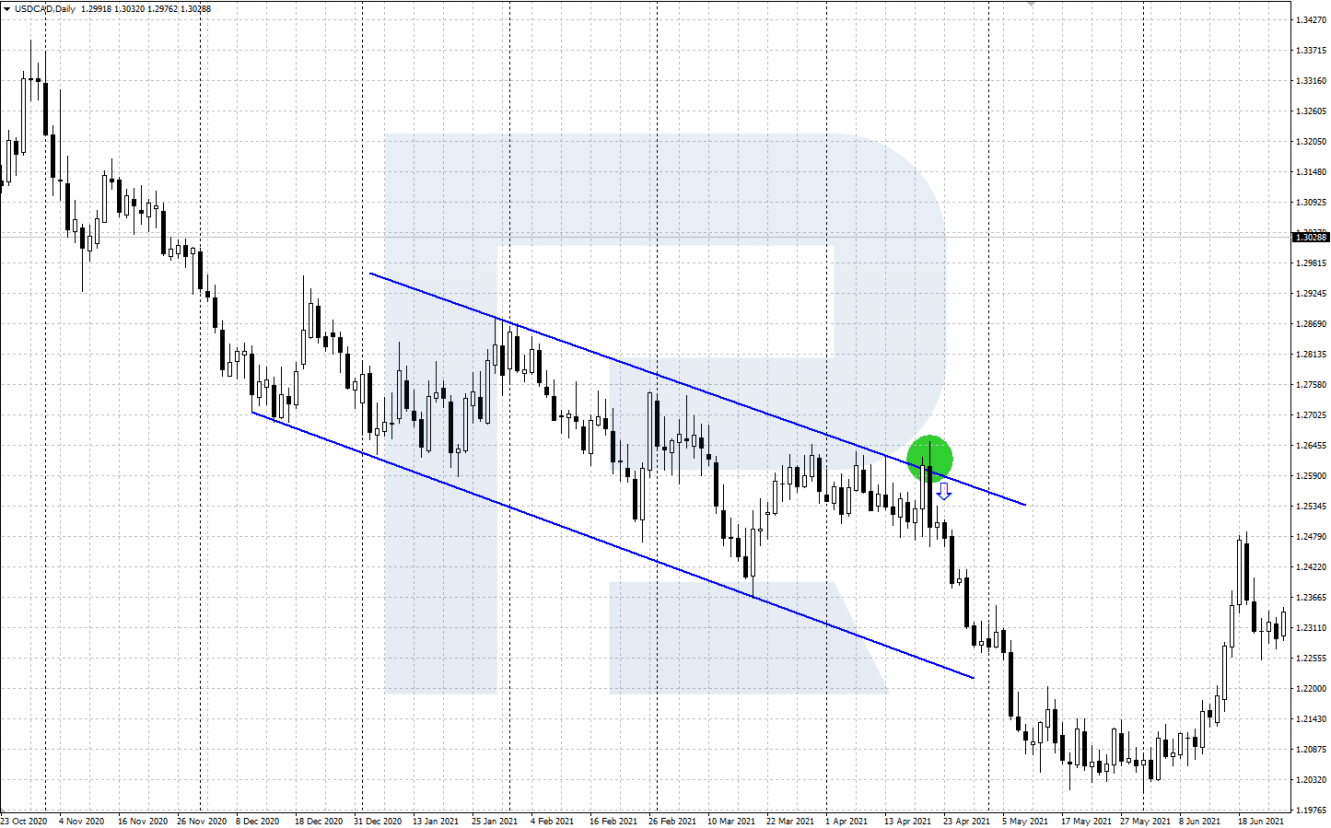
Another place where a trap can form on the chart is a strong resistance line. The situation is similar to the one above: the resistance line is broken through upwards, bulls hurry to open buying trades, but all of a sudden, the quotes reverse downwards, and the price drops below the line. Then the decline may continue.

How to detect bearish traps
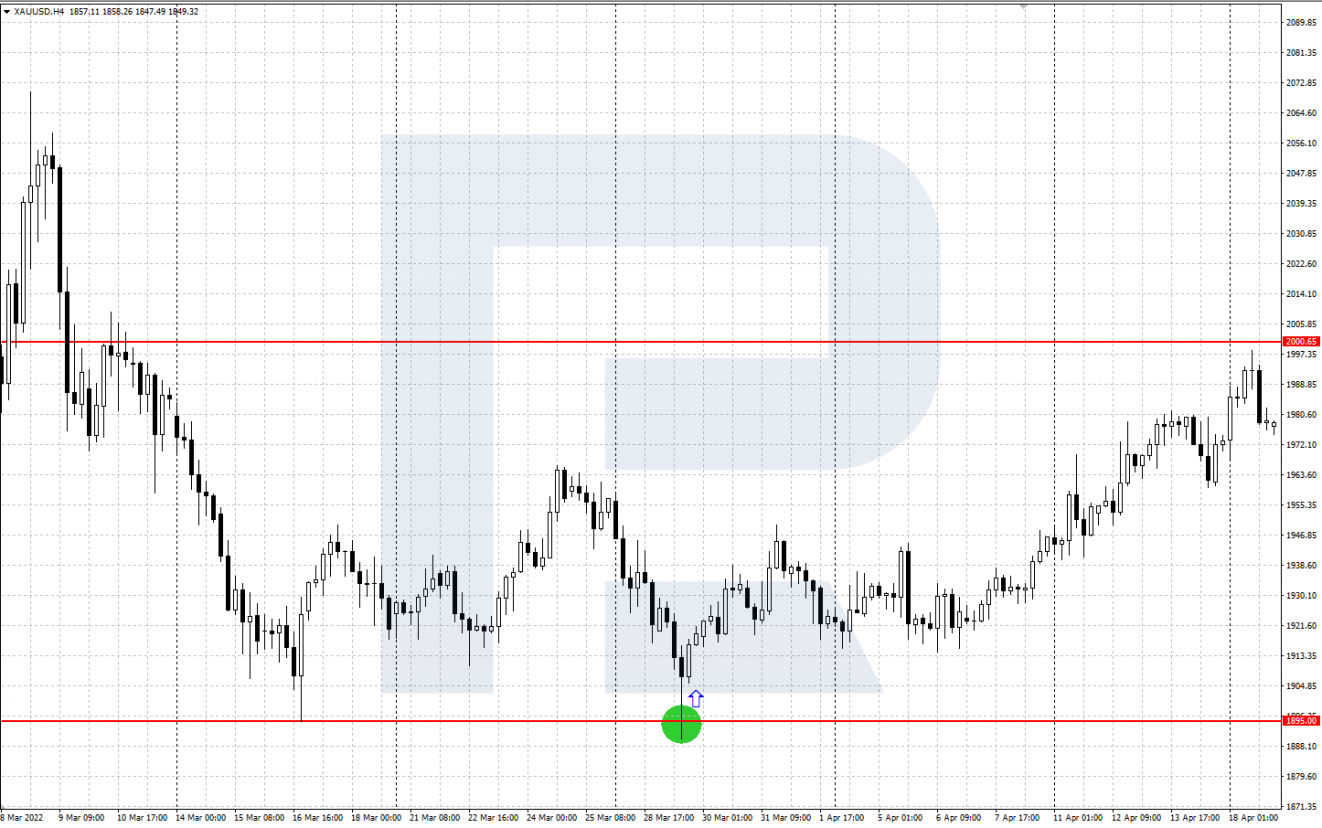
A trader can get into a bearish trap when they open a selling position at a breakaway of a strong support level. Inspired bears open short positions, counting upon further decline, but the quotes suddenly reverse and start going up.
Bears have open short positions that they need to close. As a rule, they do so if the price secures again above the support level, broken previously. Then bearish Stop Losses get triggered. As a result, the quotes get supported in their growth, and the trap locks.

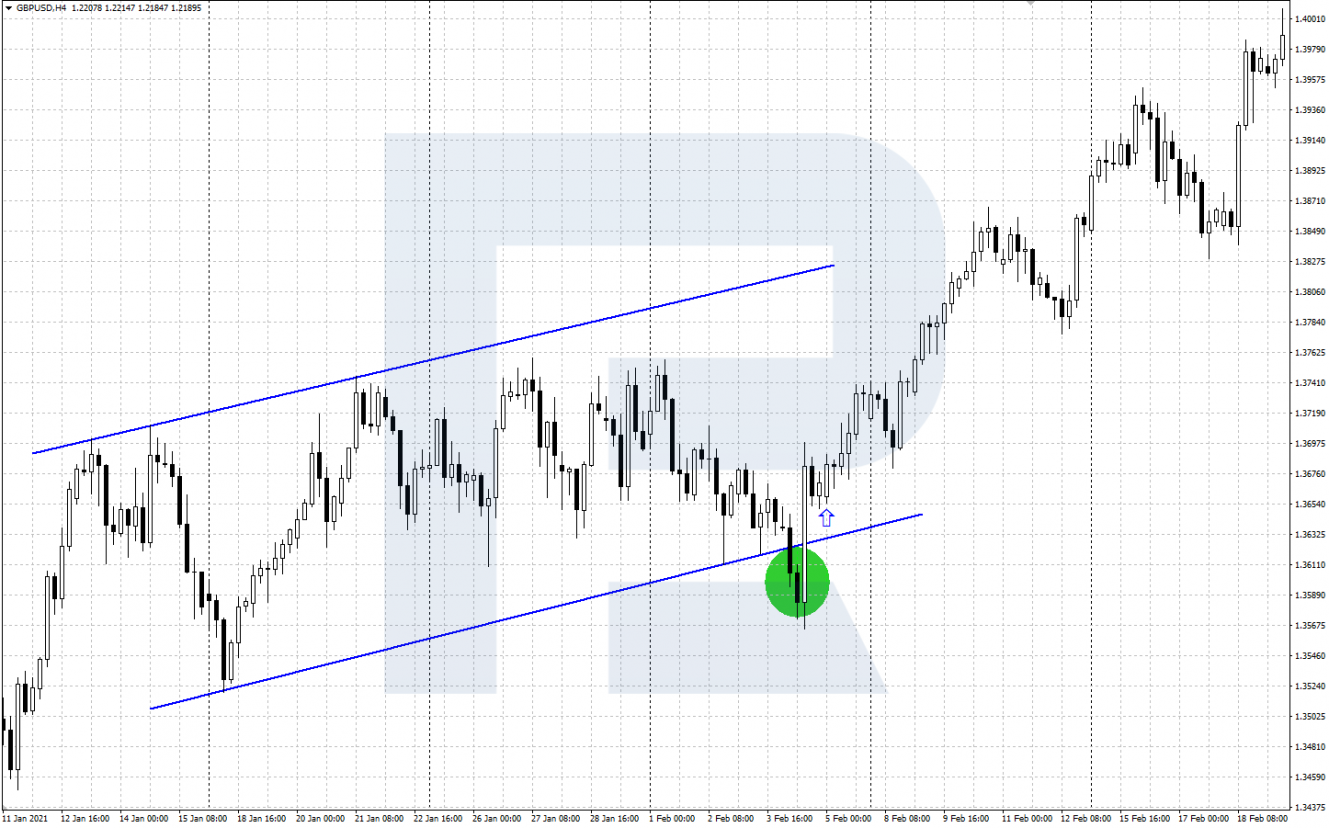
Important support lines can also be used as traps. The price makes a descending impulse, bears rush at opening sales as soon as the line is broken downwards, but suddenly the quotes reverse upwards and rise above the line. The trap is now triggered, and an ascending price impulse might start.

Whether traps can be avoided
It seems that one cannot avoid traps altogether: the market is usually unpredictable. However, such occasions can be minimised and losses can be limited by closing a losing position in time. For this, the following things are important:
- Do not rush at opening a position at a breakaway of an important support/resistance level or line. Wait for the price to close confidently above the level and only then consider opening a position when the price corrects to the level and bounces off it.
- A sign to limit losses is the return of the price under the broken level or line. A losing position should be closed because after the trap is triggered, a strong reversal price movement can follow.
- A triggered trap can be used in a strategy of trading false breakaways that was previously described in the Blog.
Bottom line
Bearish and bullish traps are quite frequent on ptice charts. As a rule, they appear near important support/resistance levels or lines.
It is almost impossible to avoid traps altogether, but knowing their peculiarities, one can minimise chances of getting trapped and decrease possible losses.
