
This article is devoted to the Cup and Handle graphic pattern, providing the main information, such as how it forms and how to trade it.
What one should now about Cup and Handle
Cup and Handle is a tech analysis pattern that forecasts the continuation of the current trend after the price stops consolidating.
The pattern was discovered and popularised by a famous trader and investor, author of several books on the stock market and the founder of a business newspaper Investors Business Daily William O’Neil.
Cup and Handle forms in an uptrend or downtrend; it is a correctional price movement that consists of two parts. The first part is the Cup and the biggest part of the correction, and the second part – the Handle – is the smaller finishing part.
The pattern can be bullish or bearish. The first one is the actual Cup and Handle that appears on the chart in an uptrend and signals about further growth of the quotes.
The bearish pattern is called Inverted Cup and Handle; it appears on the hart in a downtrend and signals about the continuation of the latter.
How does bullish Cup and Handle form
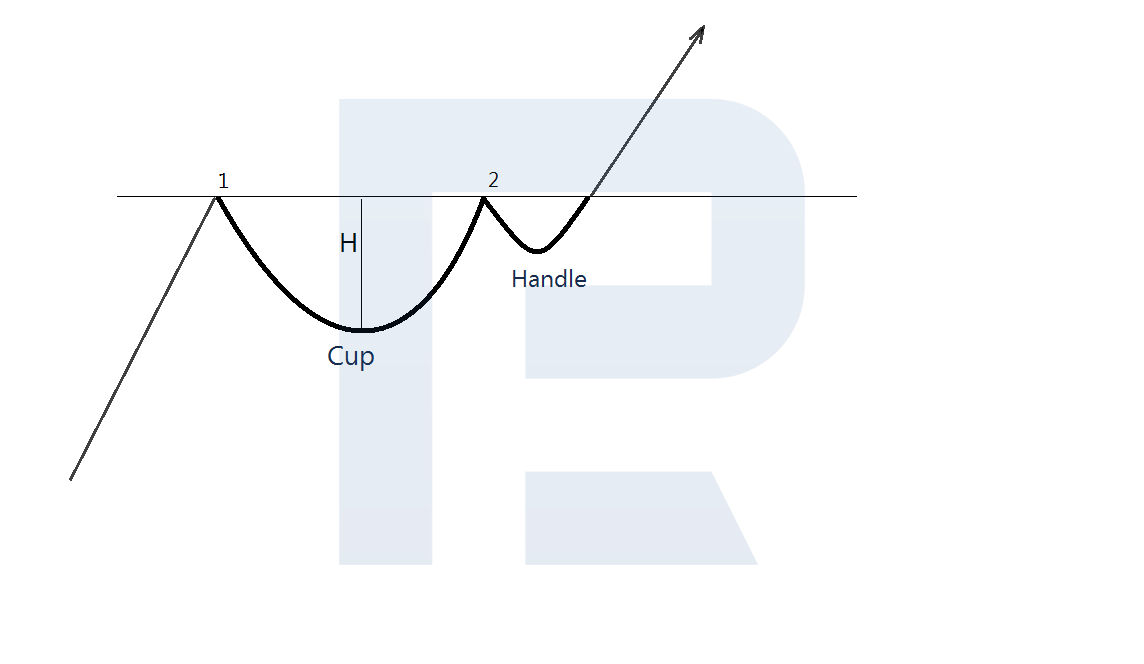
- After a downward correction starts on the chart, a price range forms that looks like a bowl or a rounded bottom. Ideally, the Cup has two same highs on both sides but this is a rare occasion.
- After the second high of the Cup forms, the price pulls back, forming the second correctional phase that resembles a Handle. This will be a minor decline (from 1/3 to ½ of the Cup) before a subsequent breakaway.
- An entry point for a buy appears when the Handle is complete and the quotes break the resistance level away upwards. It goes through the second high and links the Cup to the Handle.
- The first rough goal for the pattern after the breakaway will be the height of the Cup. Losses should be limited if the price drops below the low of the Handle.
How does Inverted Cup and Handle form
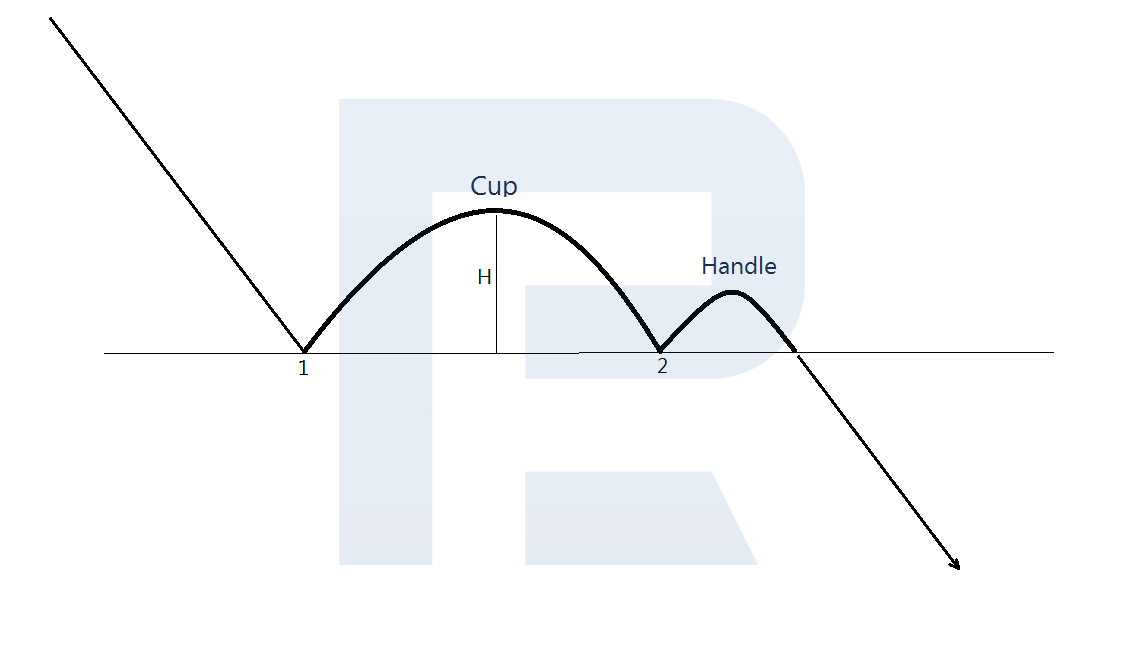
- After an upward correction starts on the chart, a price range forms that looks like an inverted bowl or a rounded top. Ideally, the Inverted Cup has two same lows on both sides but most often they differ.
- After the second low appears, the second wave of correction forms – the Handle. This will be local growth of the quotes (from 1/3 to ½ of the Cup) before further decline.
- A signal to sell appears when the Handle is complete and the quotes break through the support level downwards; the line is drawn through the second low of the pattern and links the Cup to the Handle.
- The first rough goal for the pattern after the breakaway will be the height of the Cup in points. Losses should be limited if the quotes reverse upwards and rise above the high of the Handle.
How to use Cup and Handle for trading
William O’Neil who discovered the pattern used it for trading stocks and preferred longer timeframes. He stated that the pattern on D1 should take 7 to 8 weeks to form.
However, this pattern is rather universal and can be used on various TFs with currency pairs, stock indices, oil, gold, and other liquid assets.
There are several factors potentially supporting the pattern:
- both highs or lows of the Cup are on more or less the same level;
- the Handle is no higher than the ½ of the Cup;
- the breakaway of the resistance/support level increases the volumes.
Example of buying by Cup and Handle
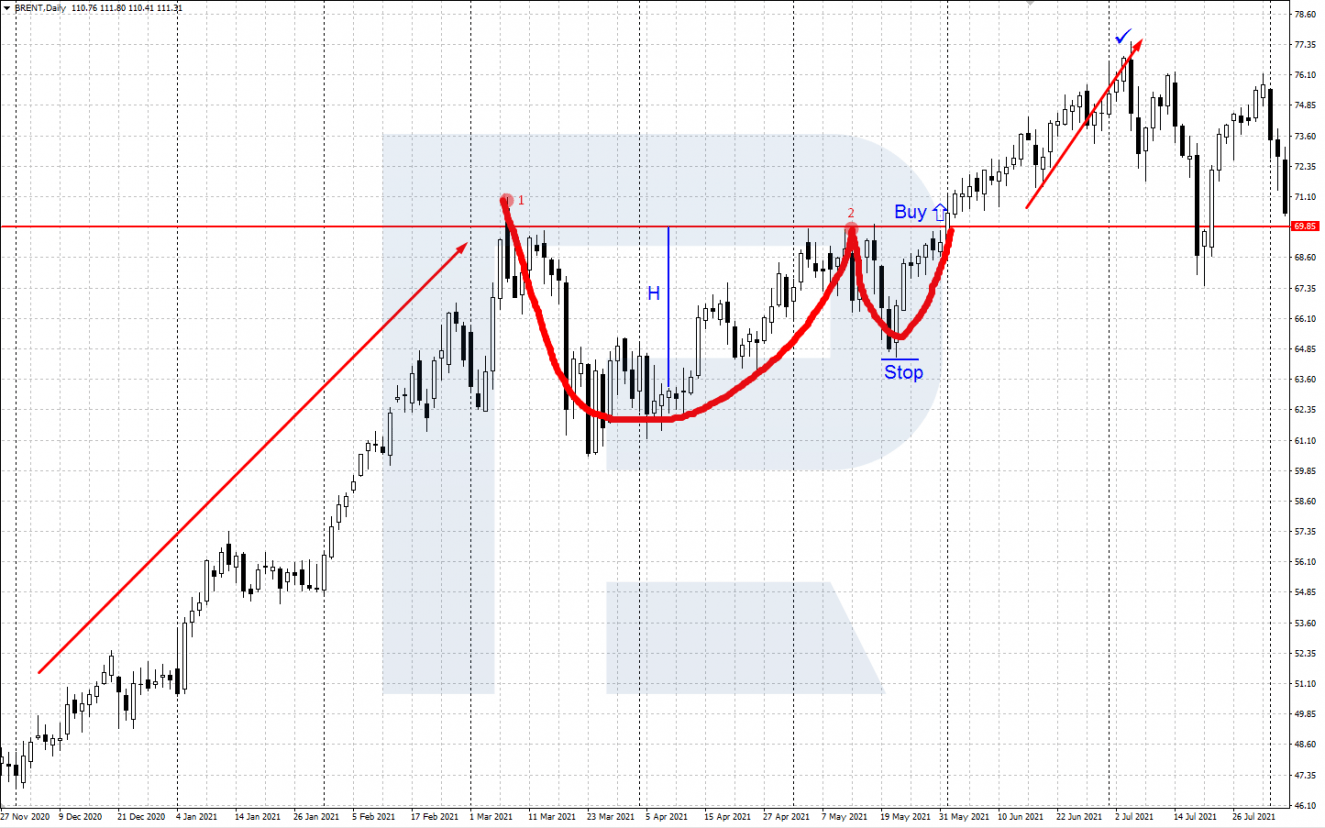
- On D1 of Brent oil, in an uptrend, a Cup and Handle pattern formed.
- After the resistance level drawn through the second high of the pattern (point 2) is broken away, the trader can buy.
- A Stop Loss is placed behind the low of the Handle.
- Profit can be taken when the quotes rise for the height (H) of the Cup.
Example of selling by Inverted Cup and Handle
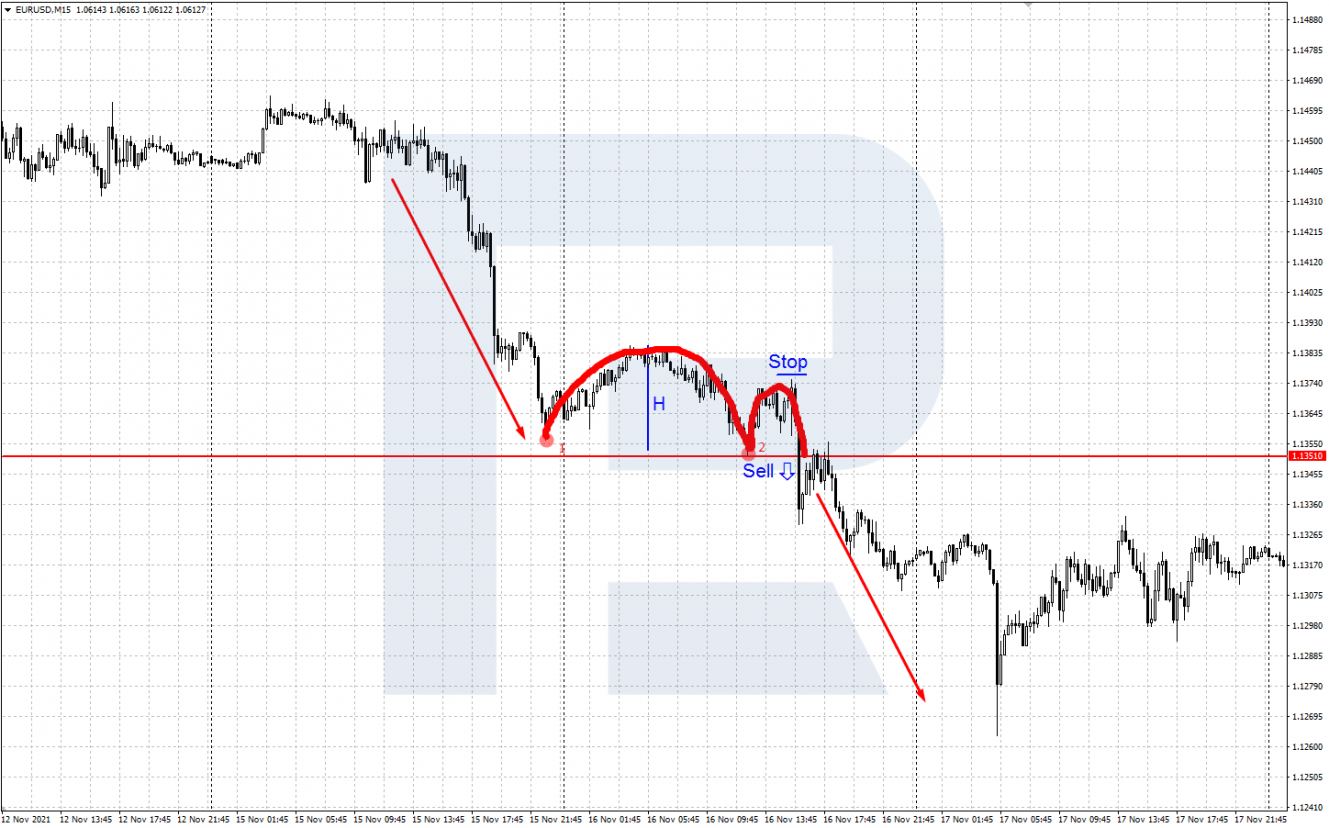
- On M15 of EUR/USD, in a downtrend, an Inverted Cup and Handle pattern formed.
- After the support level drawn through the second low of the pattern (point 2) is broken away downwards, the trader can sell.
- A Stop Loss is placed behind the high of the Handle.
- Profit can be taken when the quotes reach the highlight H (height of the Cup).
Bottom line
The Cup and Handle pattern became popular thanks to a famous trader and investor William O’Neil. This tech analysis pattern of trend continuation is quite a rare occasion on charts.
Cup and Handle can be used for trading stocks and other liquid assets. Before using the pattern for real, practicing on a demo account is recommended.
See other price patterns in the Blog:
