Gold is currently in a declining phase. In this overview, we’ll also delve into the dynamics of EUR, GBP, JPY, CHF, AUD, Brent, and the S&P 500 index.
EUR/USD (Euro vs US Dollar)
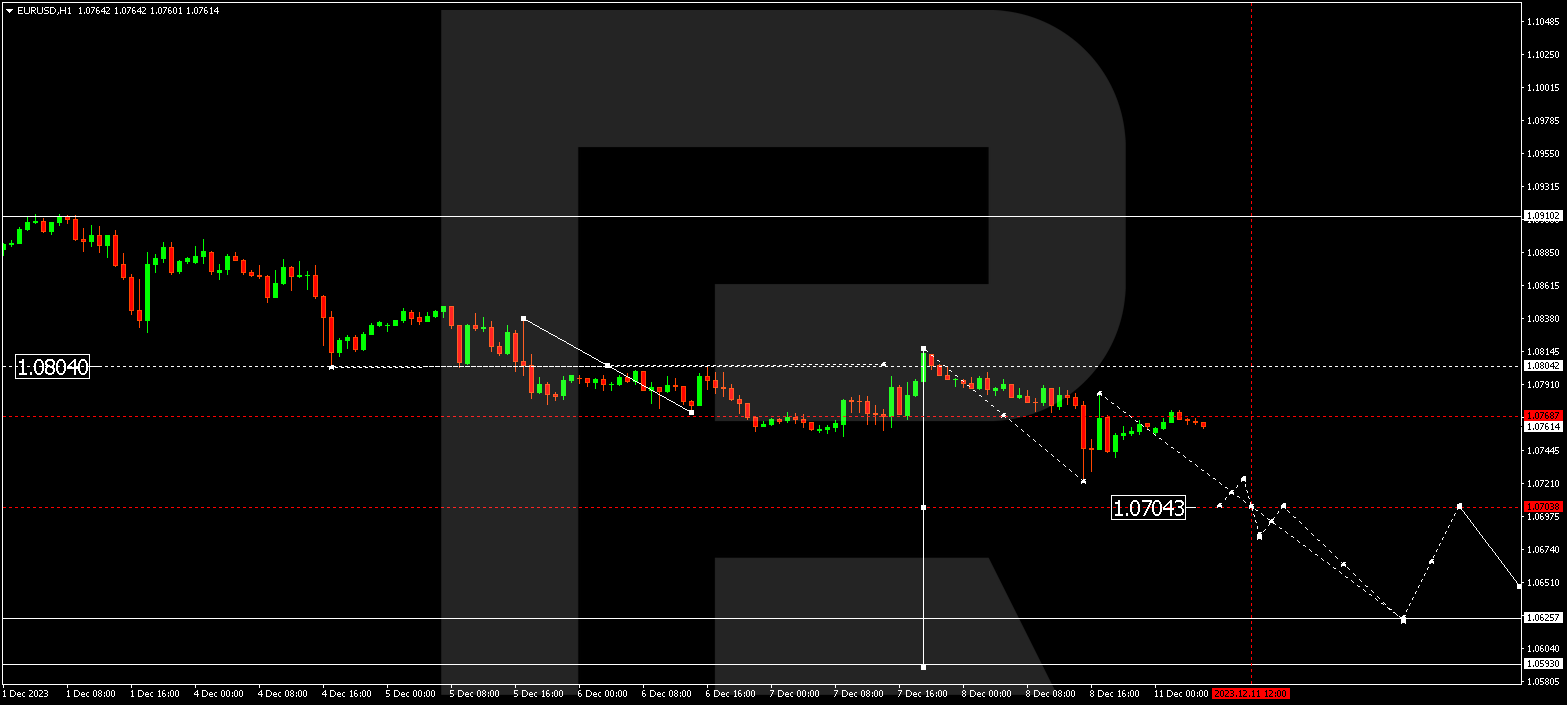
EUR/USD has completed a downward wave, reaching 1.0723. The market has undergone correction to 1.0780. Presently, a consolidation range is forming below this level. Anticipate a downward breakout to 1.0704, and with a subsequent breakout, there’s potential for a downward wave to 1.0626. This is a local target.
GBP/USD (Great Britain Pound vs US Dollar)
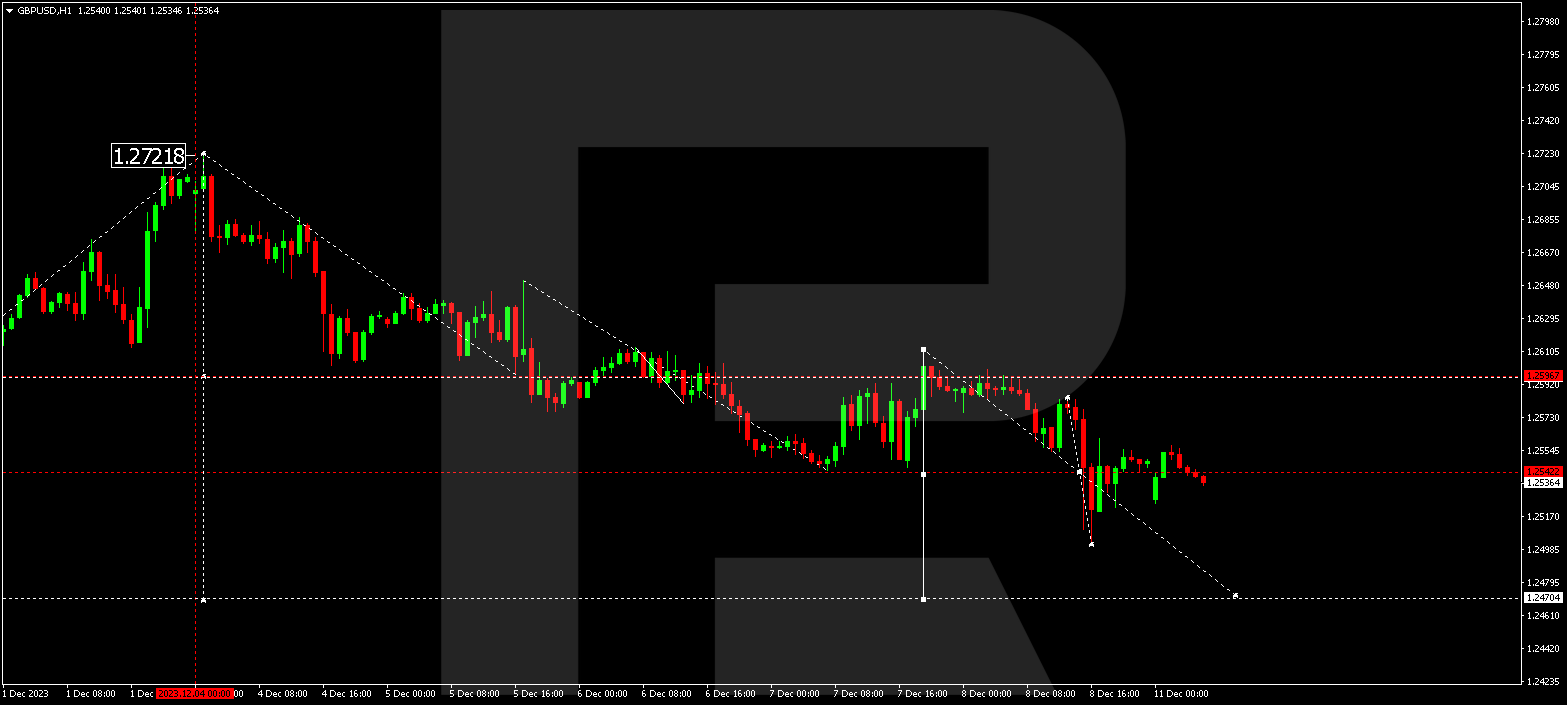
GBP/USD has finished a downward wave to 1.2502. A consolidation range is developing above this level. An anticipated downward breakout to 1.2470 may occur, possibly followed by a correction to 1.2595. Subsequently, the price might decline to 1.2400.
USD/JPY (US Dollar vs Japanese Yen)

USD/JPY has completed a growth structure, reaching 144.88. A consolidation range has formed around this level. An upward breakout from this range may lead to a wave to 147.31. This is a local target. Subsequently, a decline to 144.88 might happen (a test from above), followed by a rise to 148.15. This is the first target.


USD/CHF (US Dollar vs Swiss Franc)
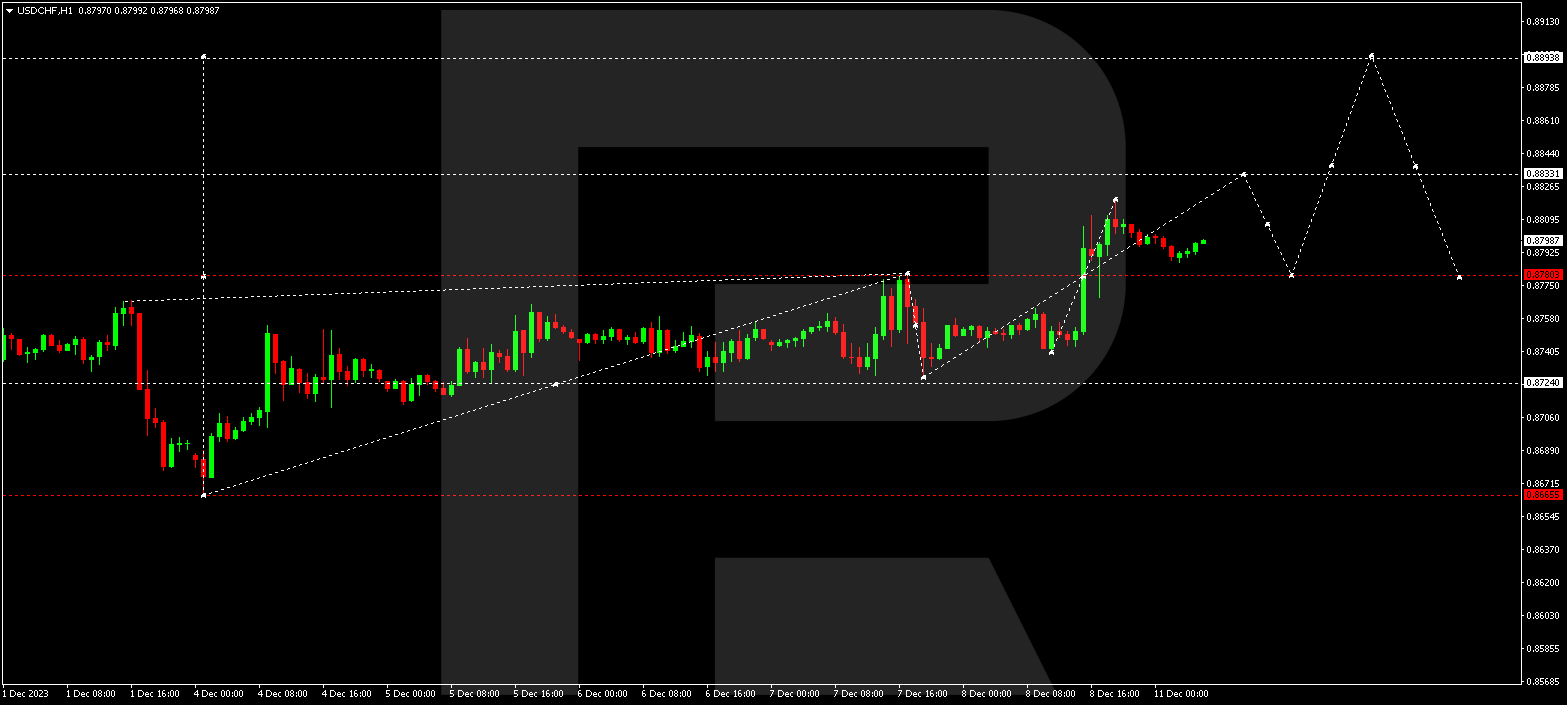
USD/CHF has concluded a rising impulse, reaching 0.8819. The pair might correct to 0.8780 today. Following the correction, a new upward wave to 0.8833 might commence, and the trend could continue to 0.8899.
AUD/USD (Australian Dollar vs US Dollar)
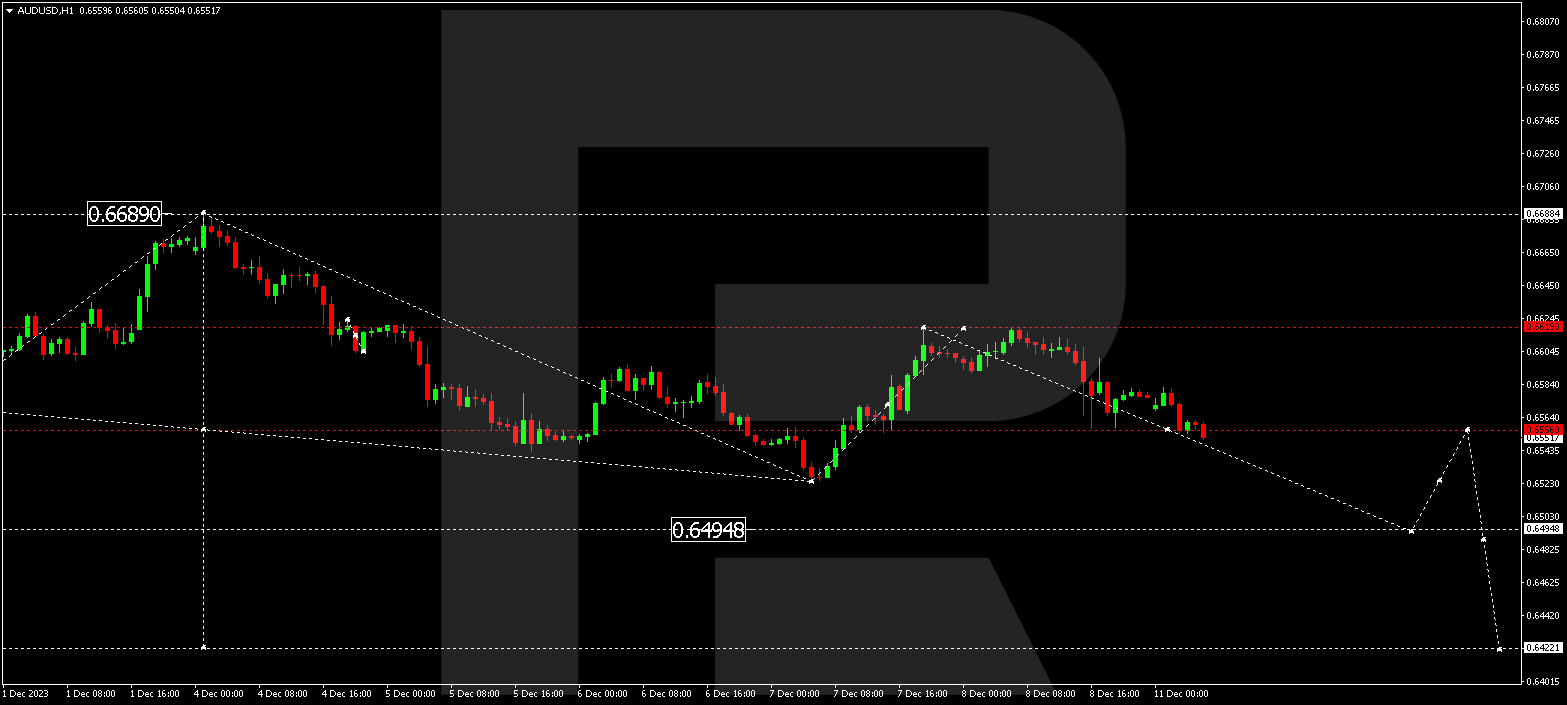
AUD/USD has completed a corrective wave to 0.6619. A new downward wave to 0.6555 has emerged. Currently, a consolidation range is forming around this level. An expected downward breakout could lead to another declining wave to 0.5495. This is a local target.
BRENT
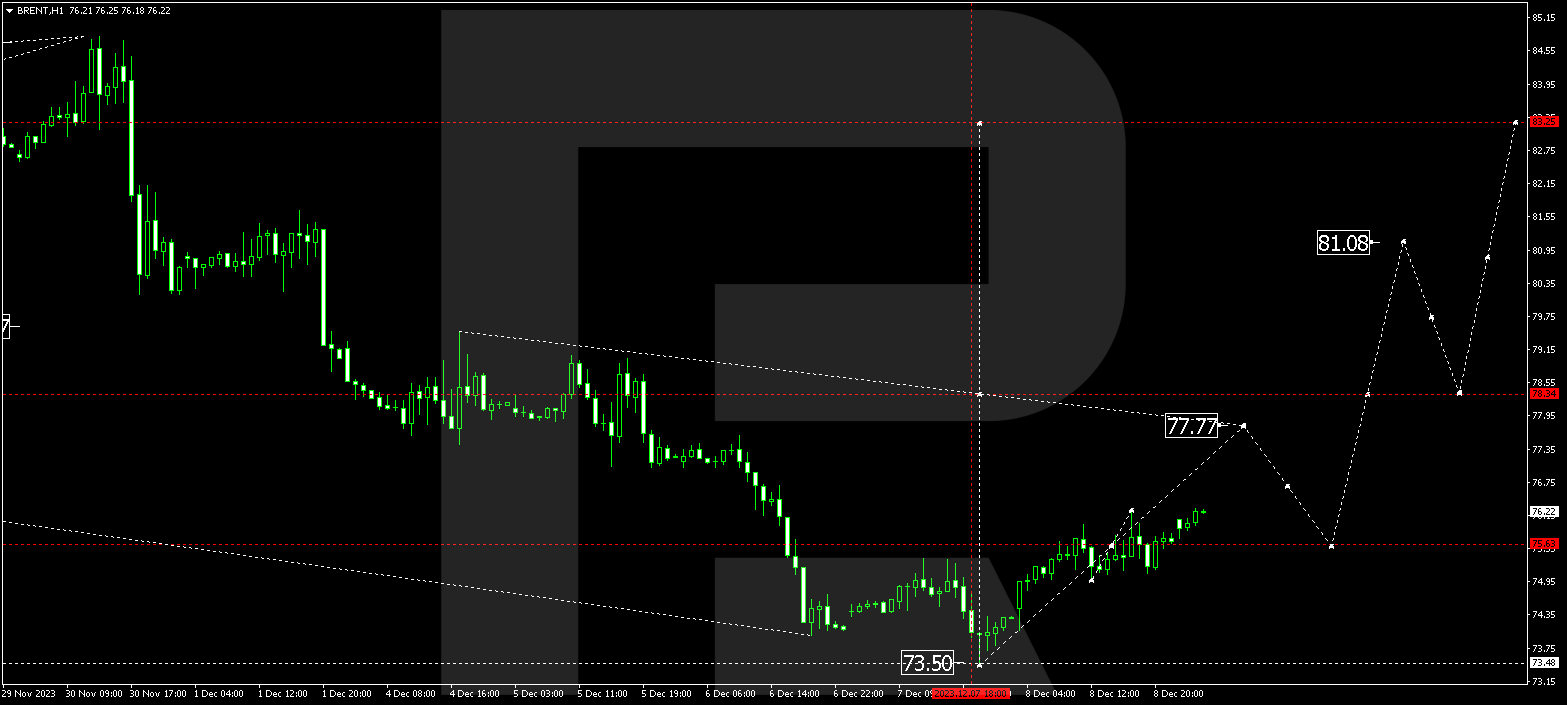
Brent is in the process of forming an upward wave to 77.77. After reaching this level, a correction link to 75.65 could develop, followed by an upward wave to 81.07. From there, the trend might continue to 83.25. This is the first target.
XAU/USD (Gold vs US Dollar)
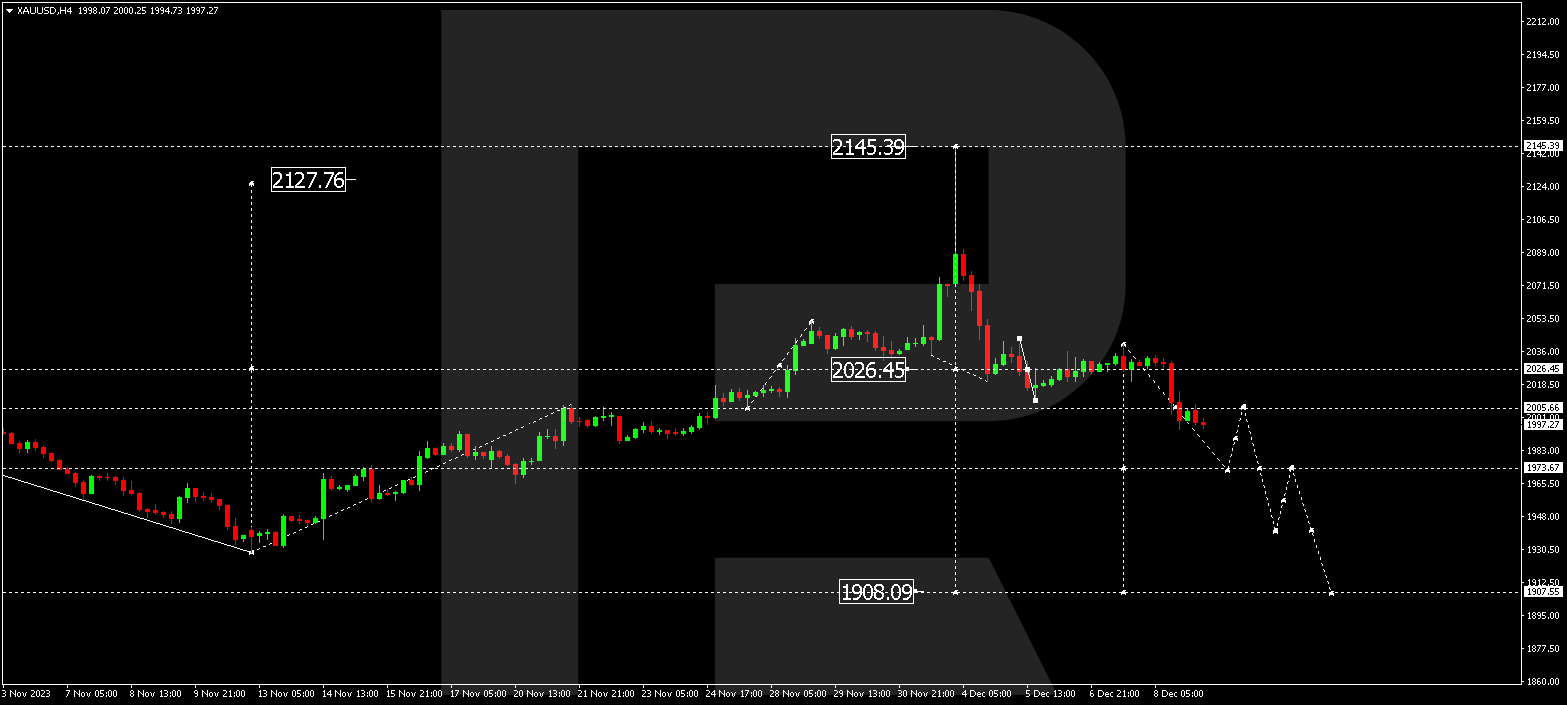
Gold has undergone a decline to 2026.45. A consolidation range has formed around this level. An anticipated downward breakout from this range could result in a new declining structure to 1908.00. Upon reaching this level, the price might initiate a correction to 2026.45 (a test from below).
S&P 500
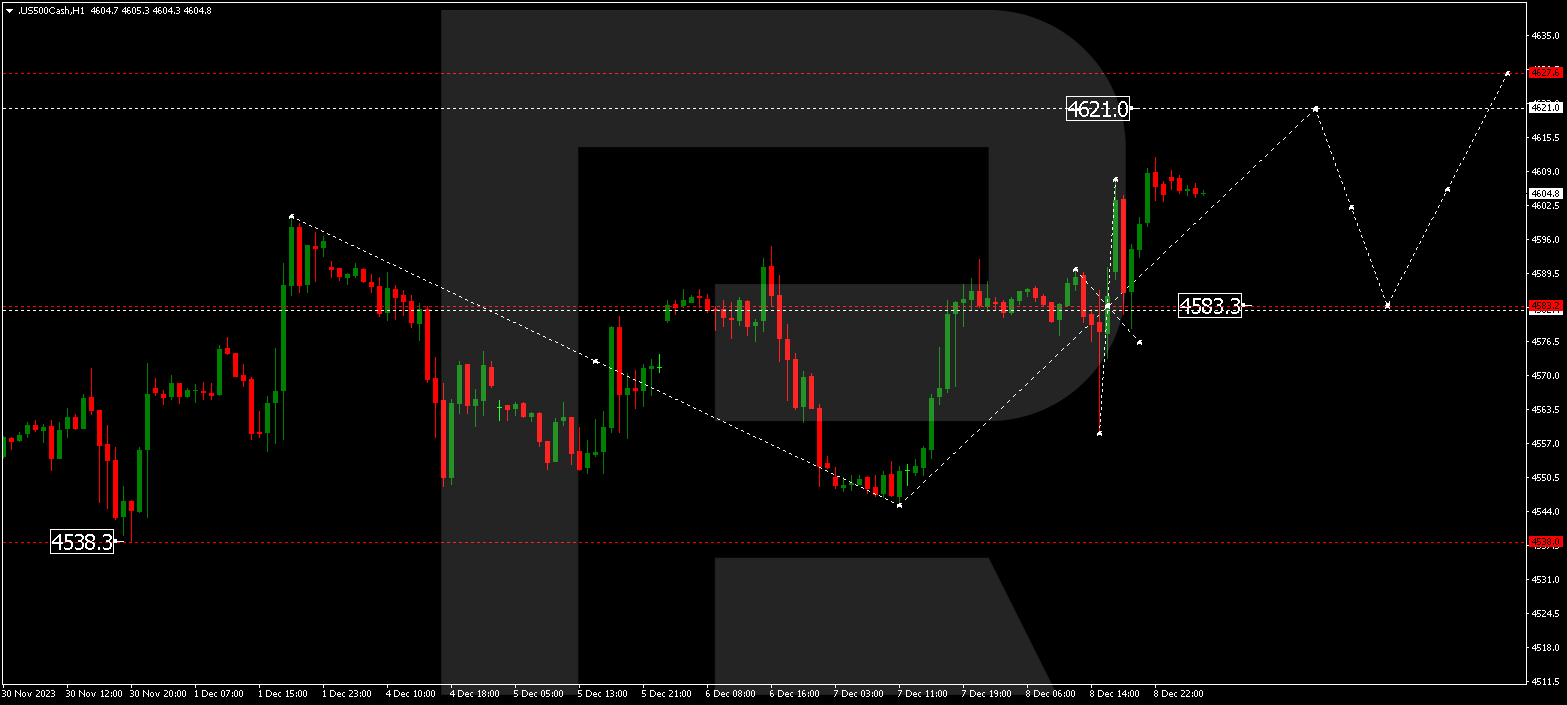
The stock index is currently forming an upward wave to 4621.0. After reaching this level, the price could undergo a correction link to 4583.3. Subsequently, a new upward wave to 4627.6 might develop.
The post Technical Analysis & Forecast December 11, 2023 appeared first at R Blog – RoboForex.