
Brent is continuing its upward momentum. The analysis also covers the movements of EUR, GBP, JPY, CHF, AUD, Gold, and the S&P 500 index.
EUR/USD (Euro vs US Dollar)
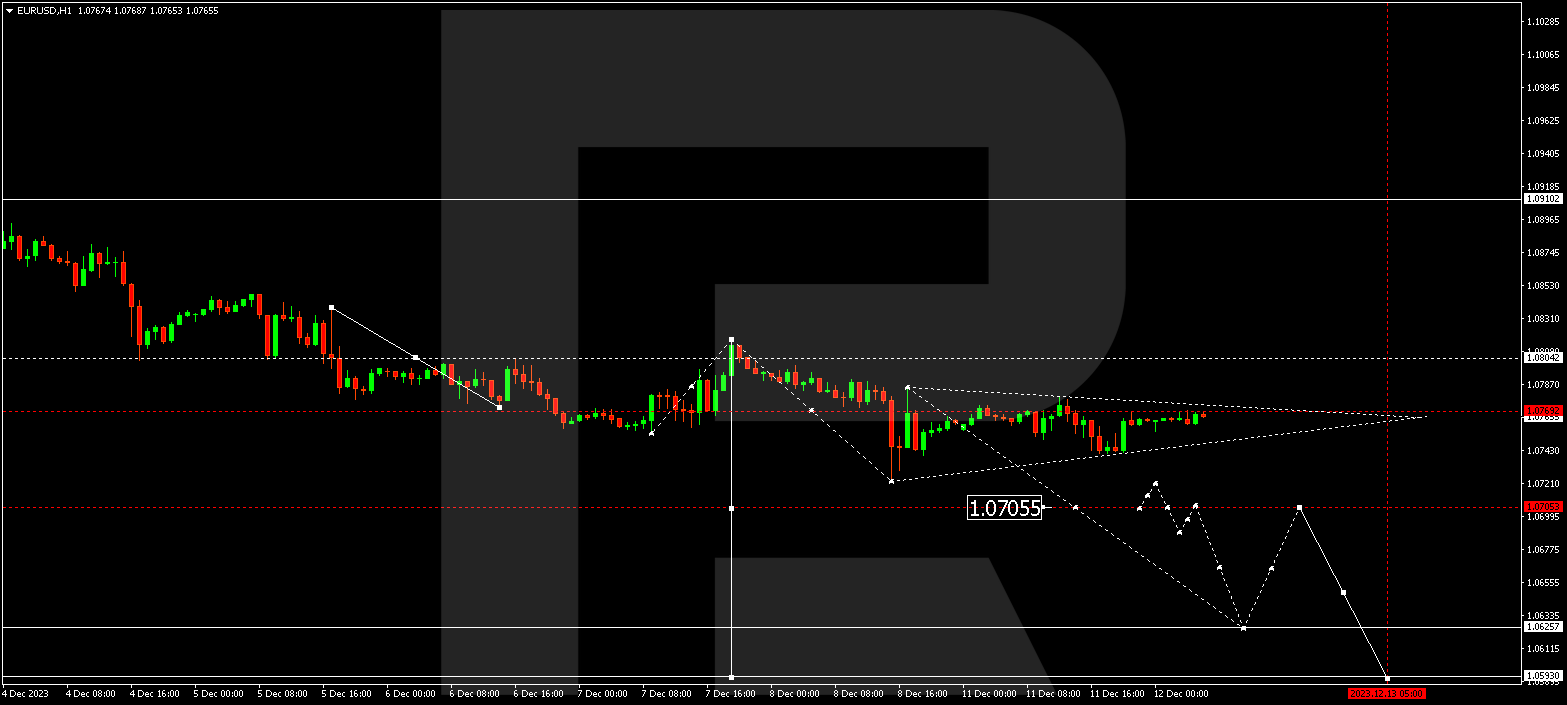
EUR/USD is currently consolidating within the range of 1.0770. In case of an upward breakout, a correction towards 1.0800 is plausible. Conversely, if the range is broken downwards, it could lead to a decline to 1.0705. If this level is breached, the trend might persist towards 1.0600, marking the initial target.
GBP/USD (Great Britain Pound vs US Dollar)
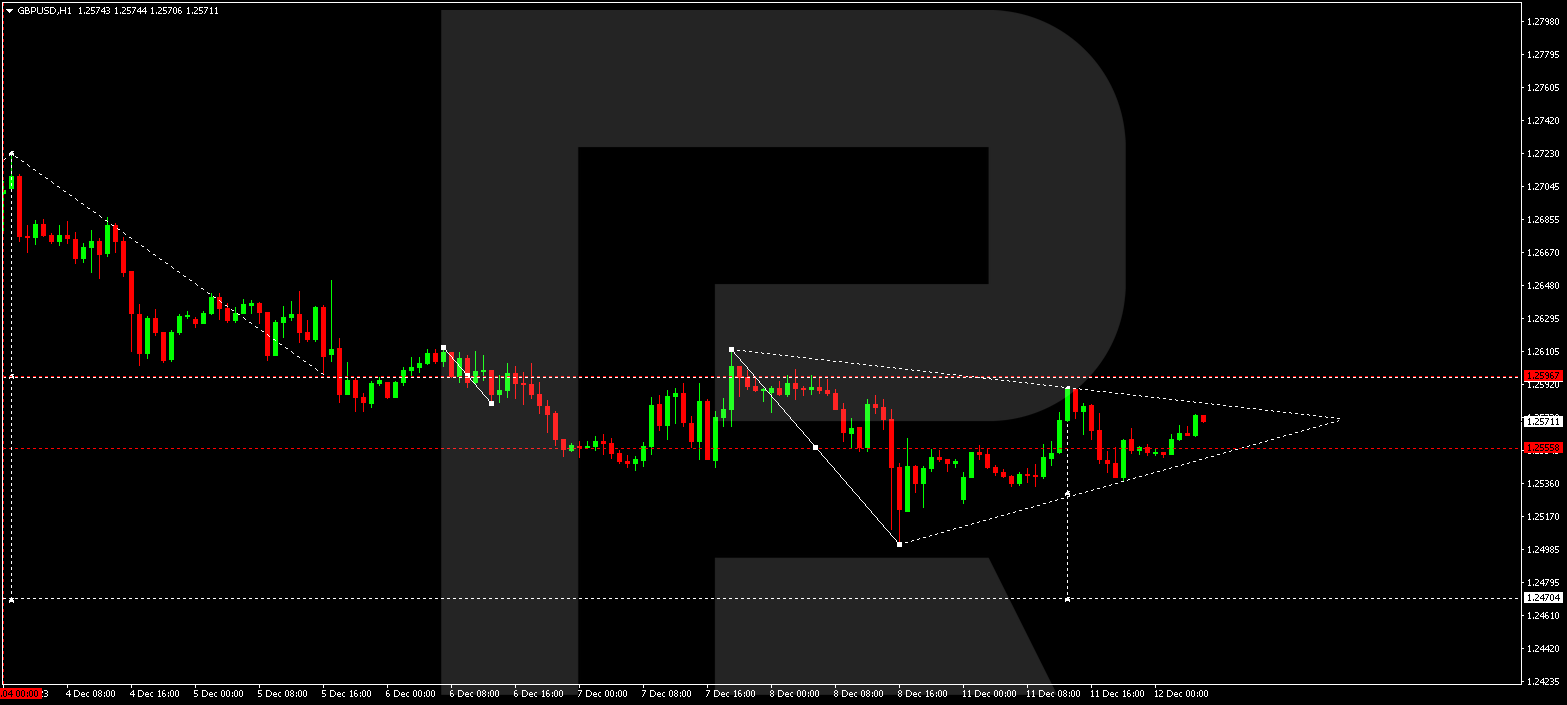
GBP/USD is in the process of forming a consolidation range around 1.2555. A potential rise to 1.2595 is conceivable, followed by a decline to 1.2470, constituting the first target. Subsequently, a correction towards 1.2595 could occur (a test from below).
USD/JPY (US Dollar vs Japanese Yen)
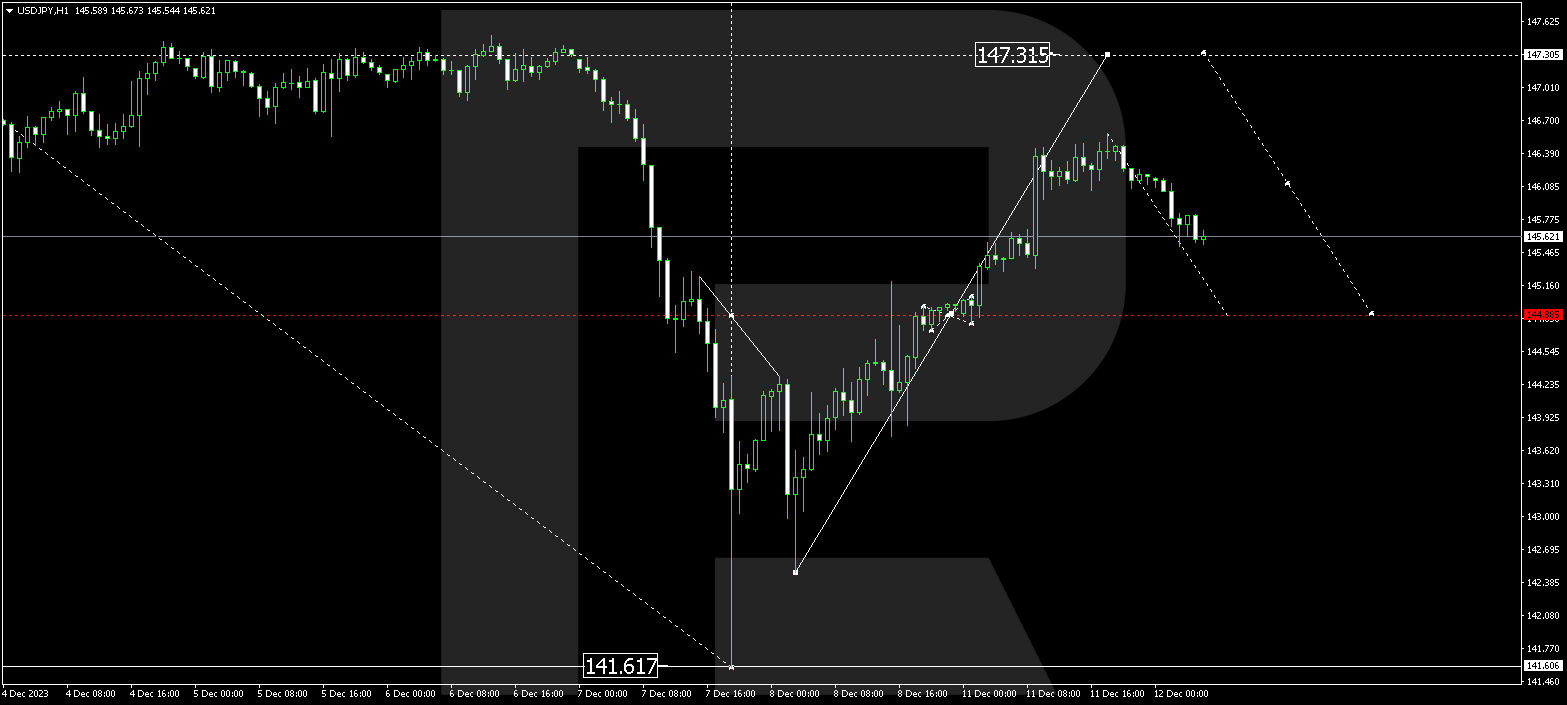
USD/JPY has completed an upward structure to 146.57. A correction to 144.88 (a test from above) might happen today. Following this, a new upward structure to 147.30 is plausible, representing a local target.


USD/CHF (US Dollar vs Swiss Franc)
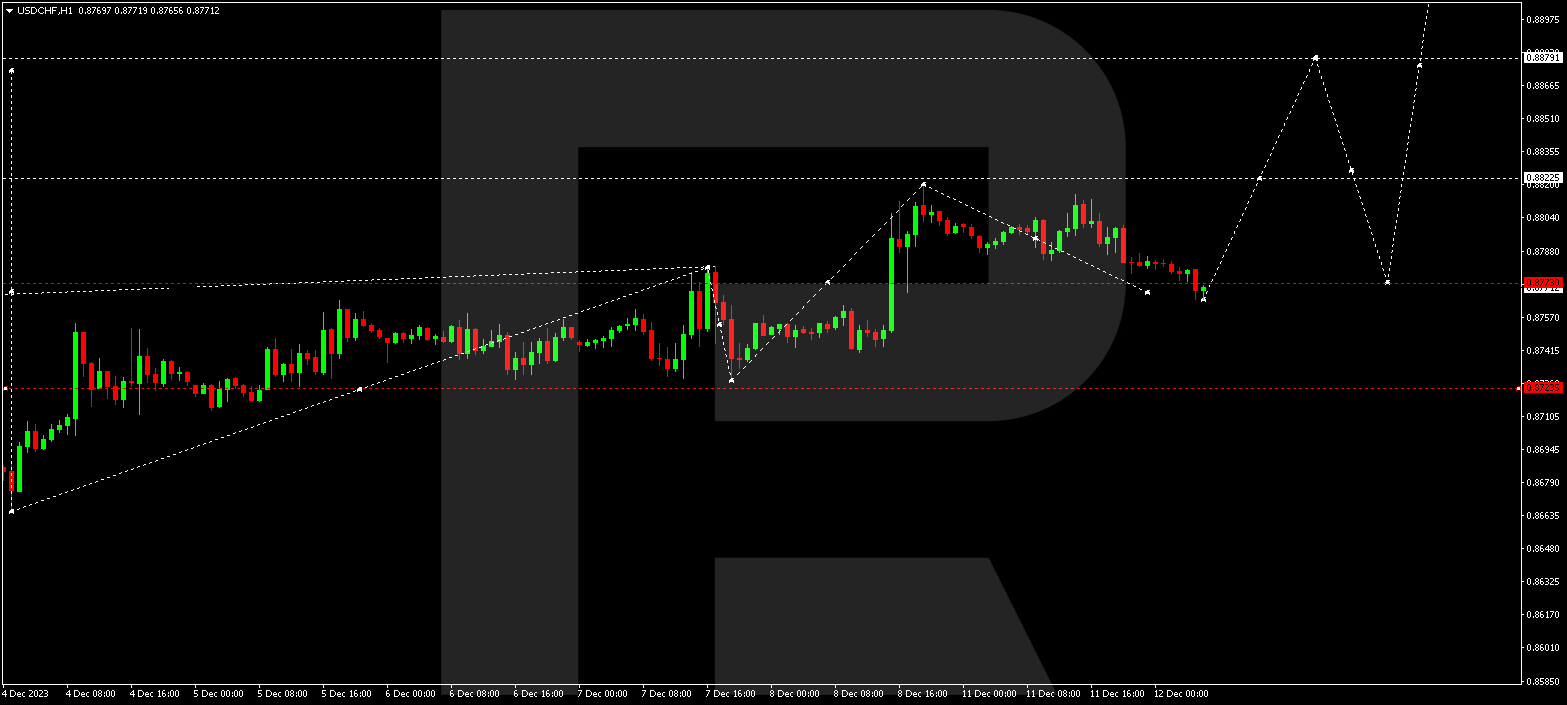
USD/CHF has corrected to 0.8767, with expectations of a consolidation range forming around this level. A downside breakout could extend the correction to 0.8727. Conversely, an upside breakout might propel the growth wave to 0.8825, furthering the trend to 0.8880, marking the initial target.
AUD/USD (Australian Dollar vs US Dollar)
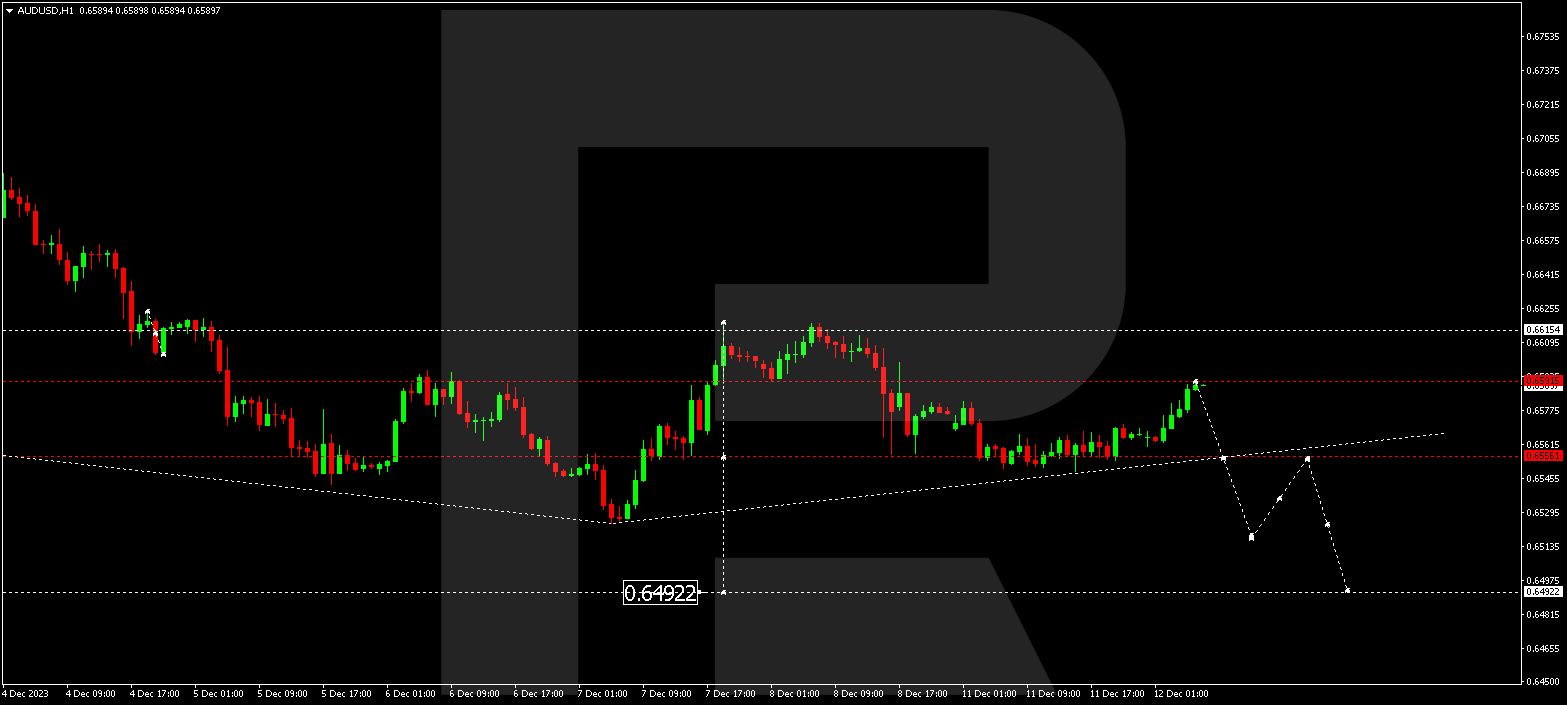
AUD/USD has completed a descending wave to 0.6550. Today, an ascending link to 0.6595 has materialized, leading to the formation of a wide consolidation range around 0.6570. A downward breakout could lead to a decline to 0.6490, while an upward breakout might extend the correction to 0.6650. Subsequently, a downward trend could persist to 0.6490.
BRENT
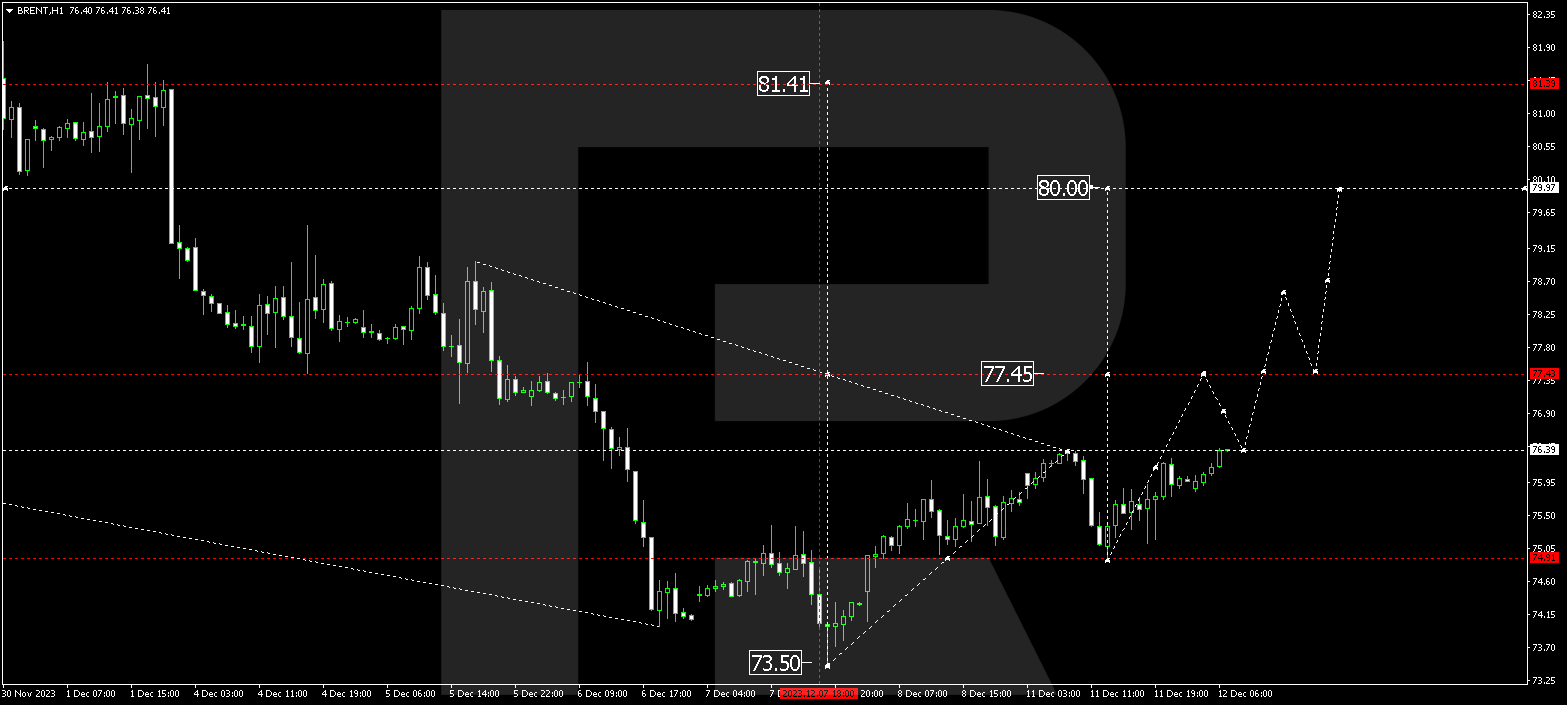
Brent has concluded a correction to 74.94, followed by an upward link to 76.40. An anticipated breakout upwards might extend the growth wave to 77.44, furthering the trend to 80.00, representing a local target.
XAU/USD (Gold vs US Dollar)
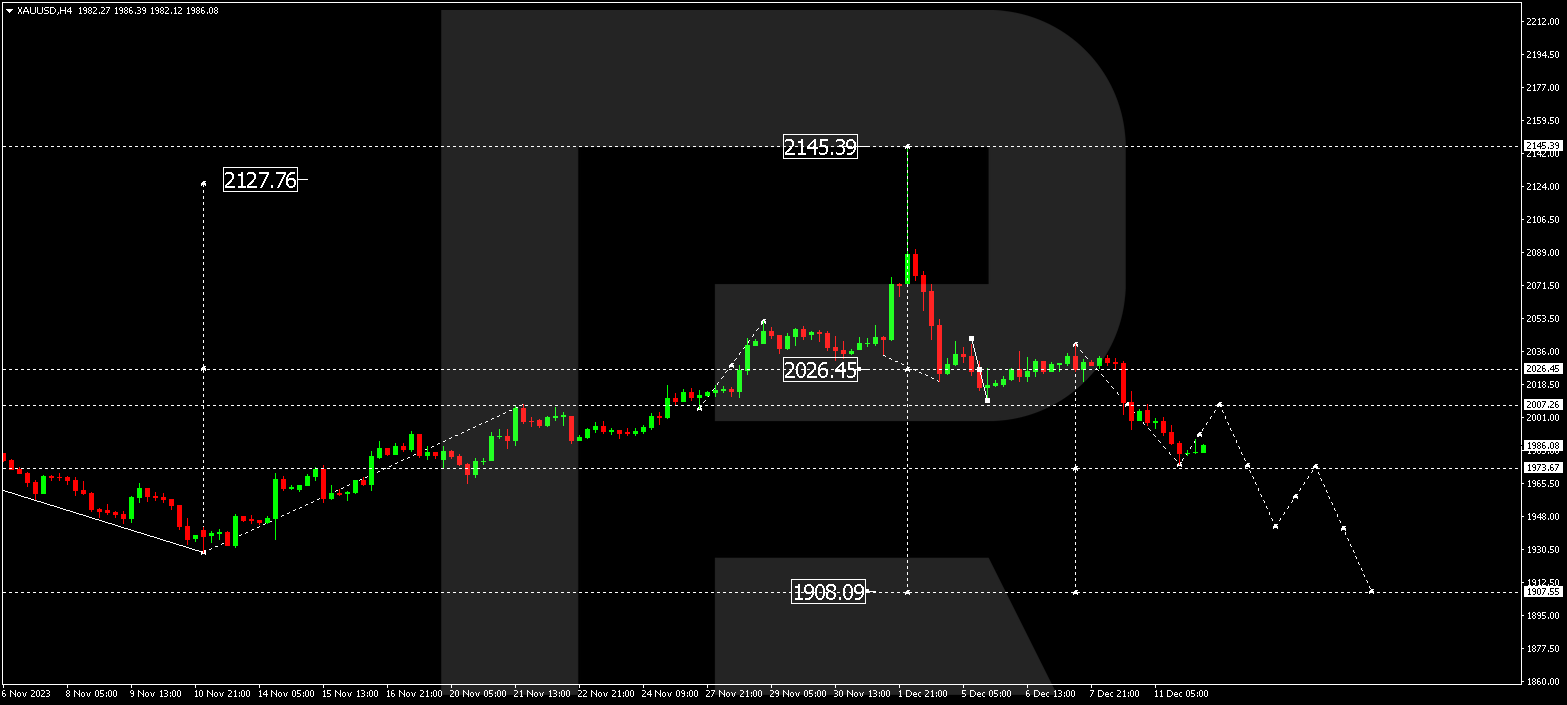
Gold has finalized a downward wave to 1976.40. Today, a correction link to 2007.20 (a test from below) could transpire. Post-correction, the downward wave might extend to 1948.00, furthering the trend to 1907.55, marking the initial target.
S&P 500
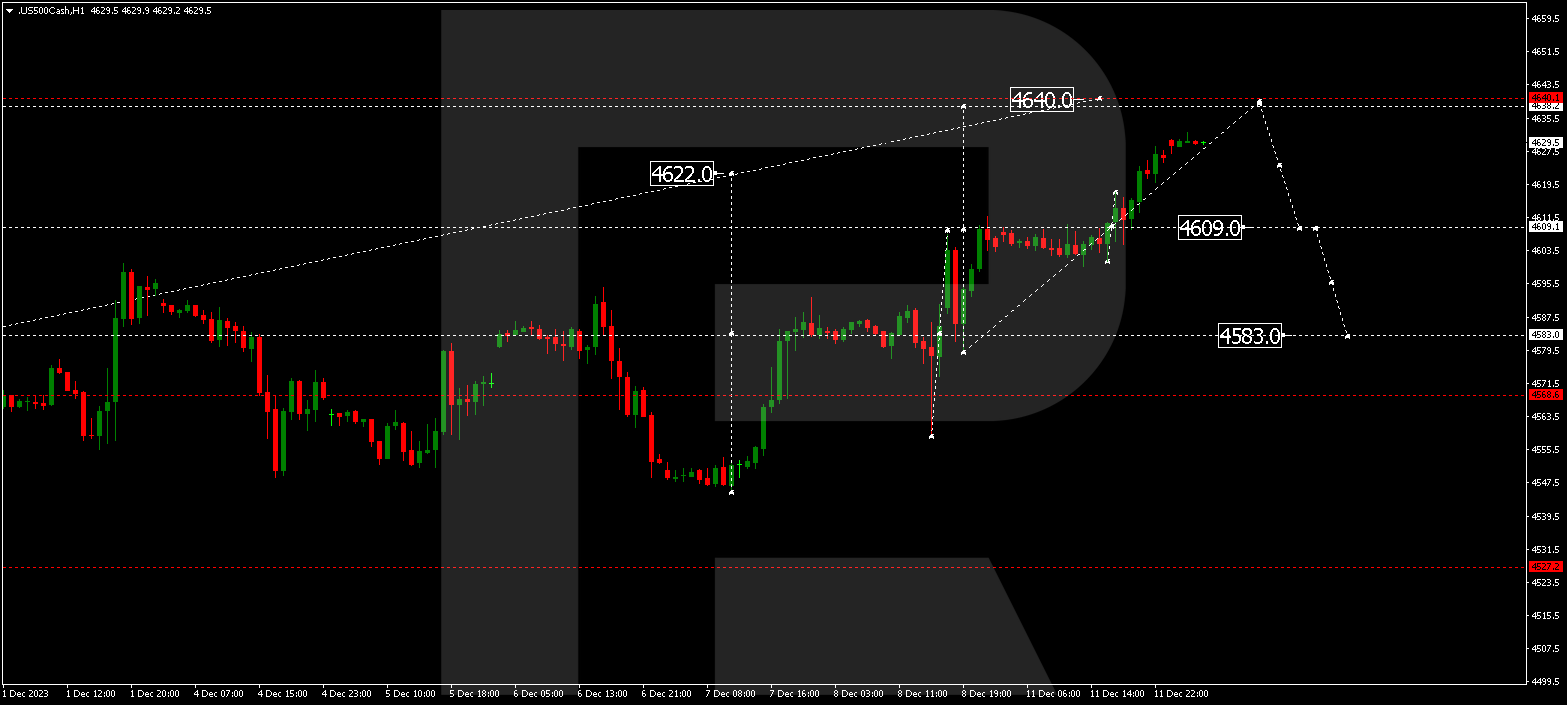
The stock index has formed a consolidation range around 4609.0. There’s a likelihood of extending the growth structure to 4638.0, with an upward breakout from the range. Following this, a decline wave to 4583.0 could initiate, marking the first target.
The post Technical Analysis & Forecast December 12, 2023 appeared first at R Blog – RoboForex.