JPY Poised for Continued Correction: Overview for EUR, USD, CHF, AUD, Brent, Gold, and S&P 500
EUR/USD (Euro vs US Dollar)
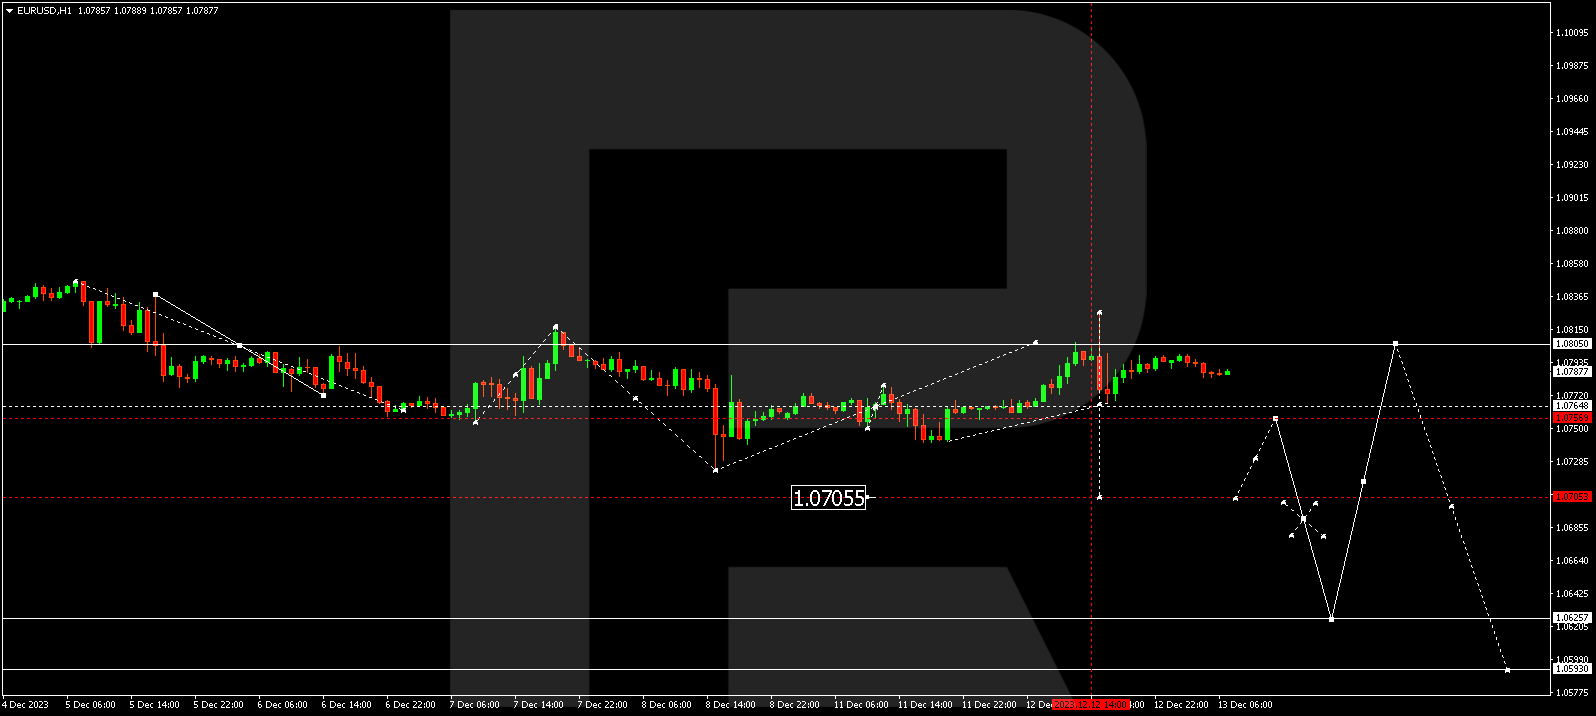
EUR/USD broke free from a consolidation range, concluding a growth wave at 1.0826. Subsequently, a decline impulse brought the price to 1.0766. The market is presently shaping a fresh consolidation range around 1.0788. An upward breakout could extend the correction to 1.0844, while a downward breakout opens the potential for a decline wave to 1.0740, with a subsequent extension to 1.0626. This marks a local target.
GBP/USD (Great Britain Pound vs US Dollar)
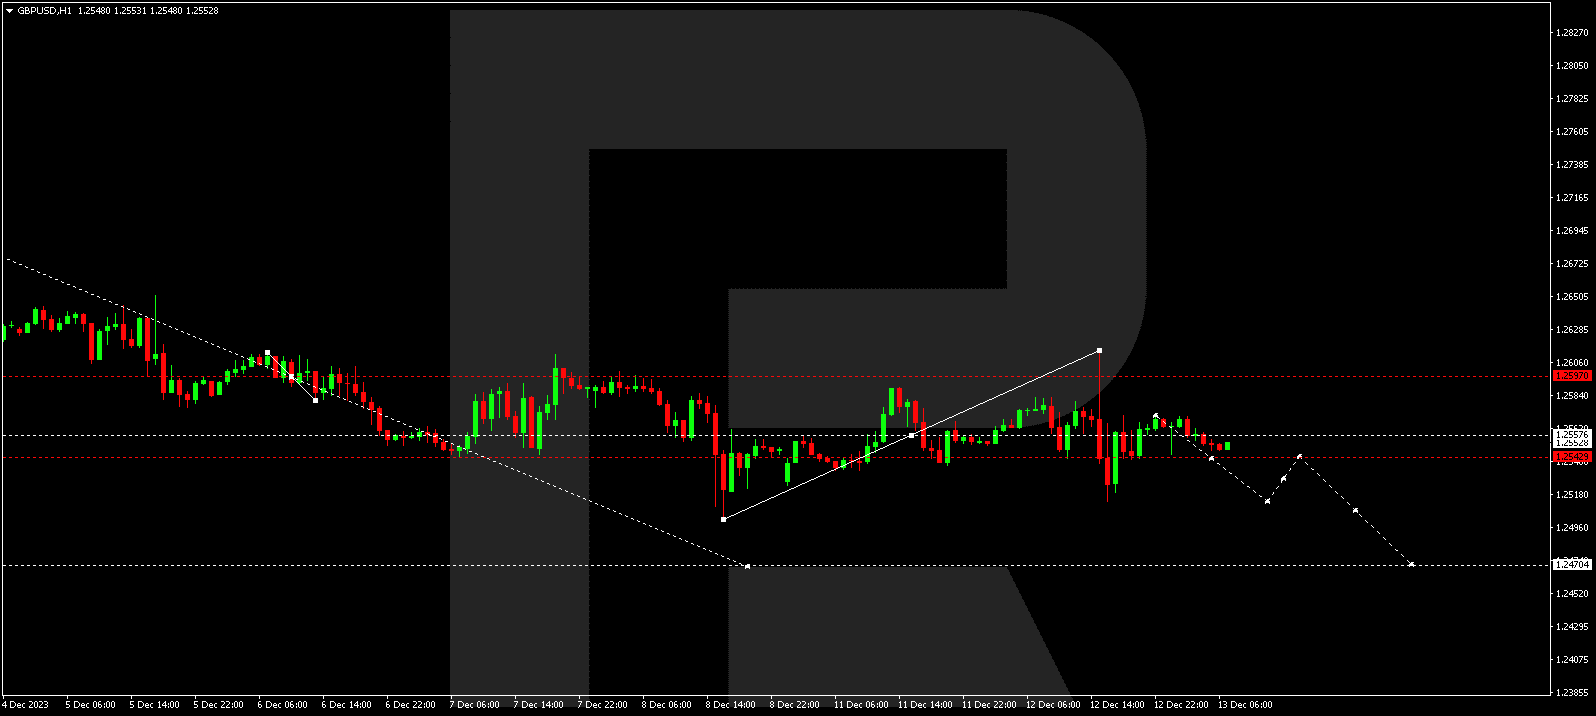
GBP/USD broke out of a consolidation range upwards, reaching the correction wave target at 1.2614. Following this, a decline impulse occurred at 1.2514. The quotes are expected to consolidate around 1.2555. An upward breakout may lead to a growth link to 1.2615, while a downward breakout opens the potential for a decline wave to 1.2470.
USD/JPY (US Dollar vs Japanese Yen)
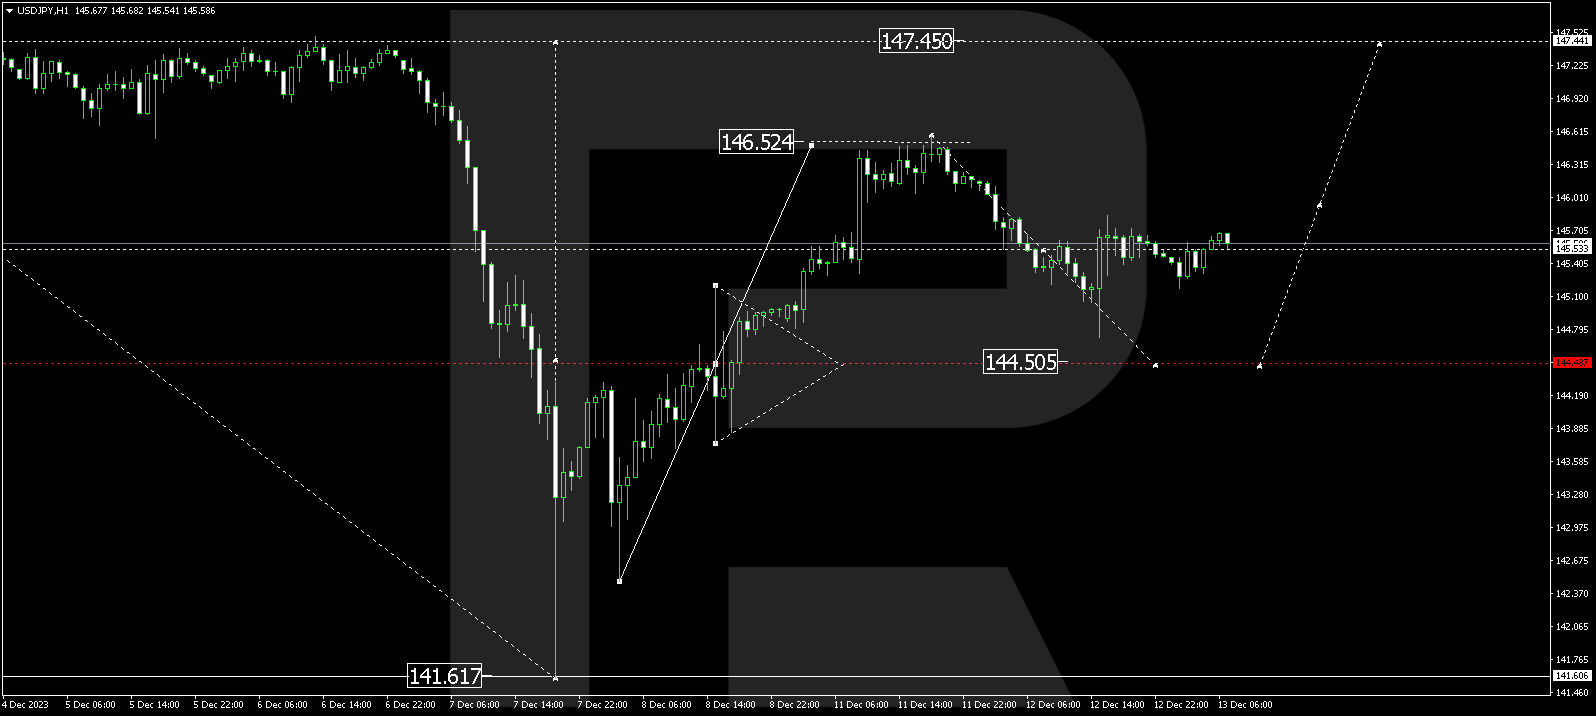
USD/JPY concluded a correction structure at 144.73. The market may continue correcting to 144.48 (a test from above). Following this correction, a growth structure to 147.40 is anticipated, marking the first target.


USD/CHF (US Dollar vs Swiss Franc)
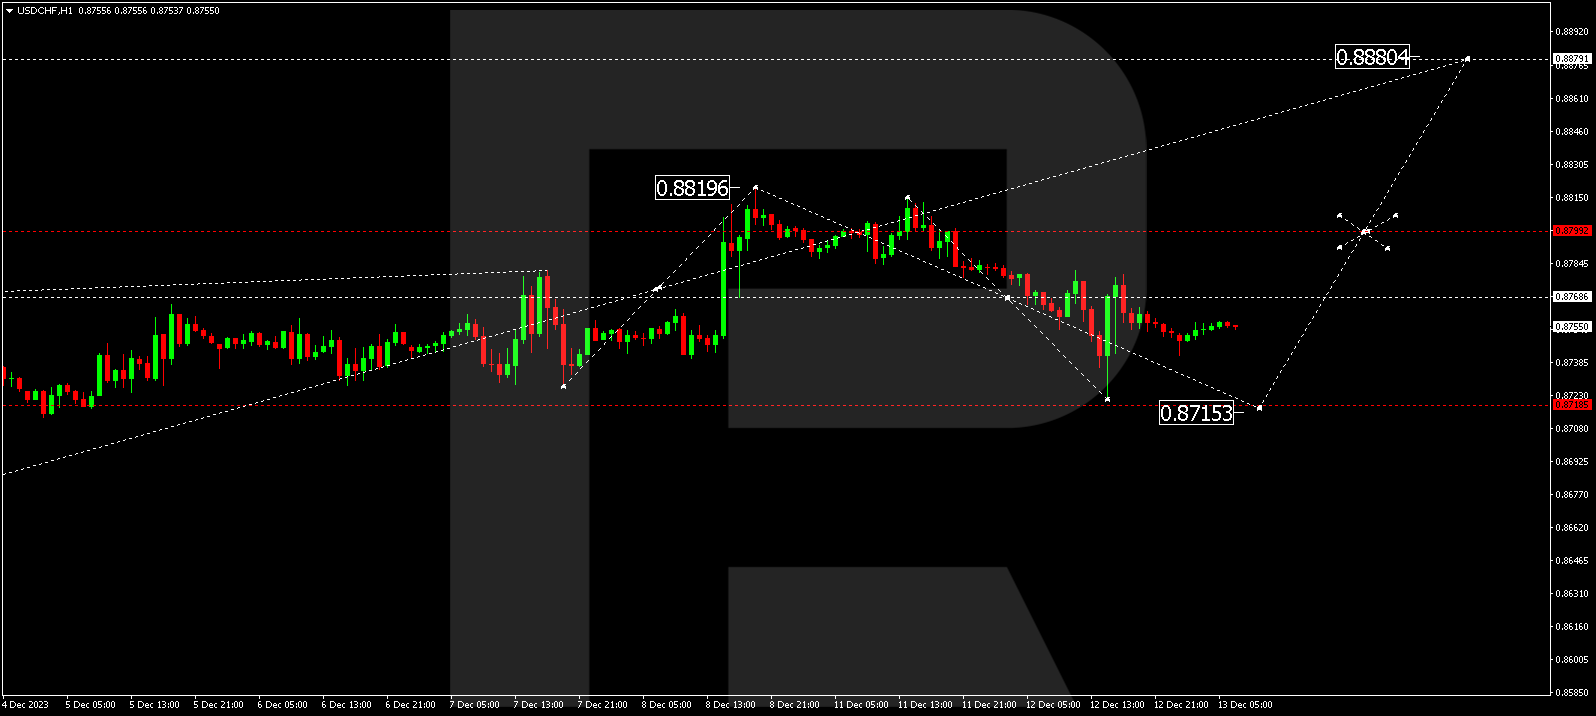
USD/CHF completed a correction to 0.8722, with a possible extension to 0.8715. Following the correction, a growth wave to 0.8880 could follow, representing the first target.
AUD/USD (Australian Dollar vs US Dollar)
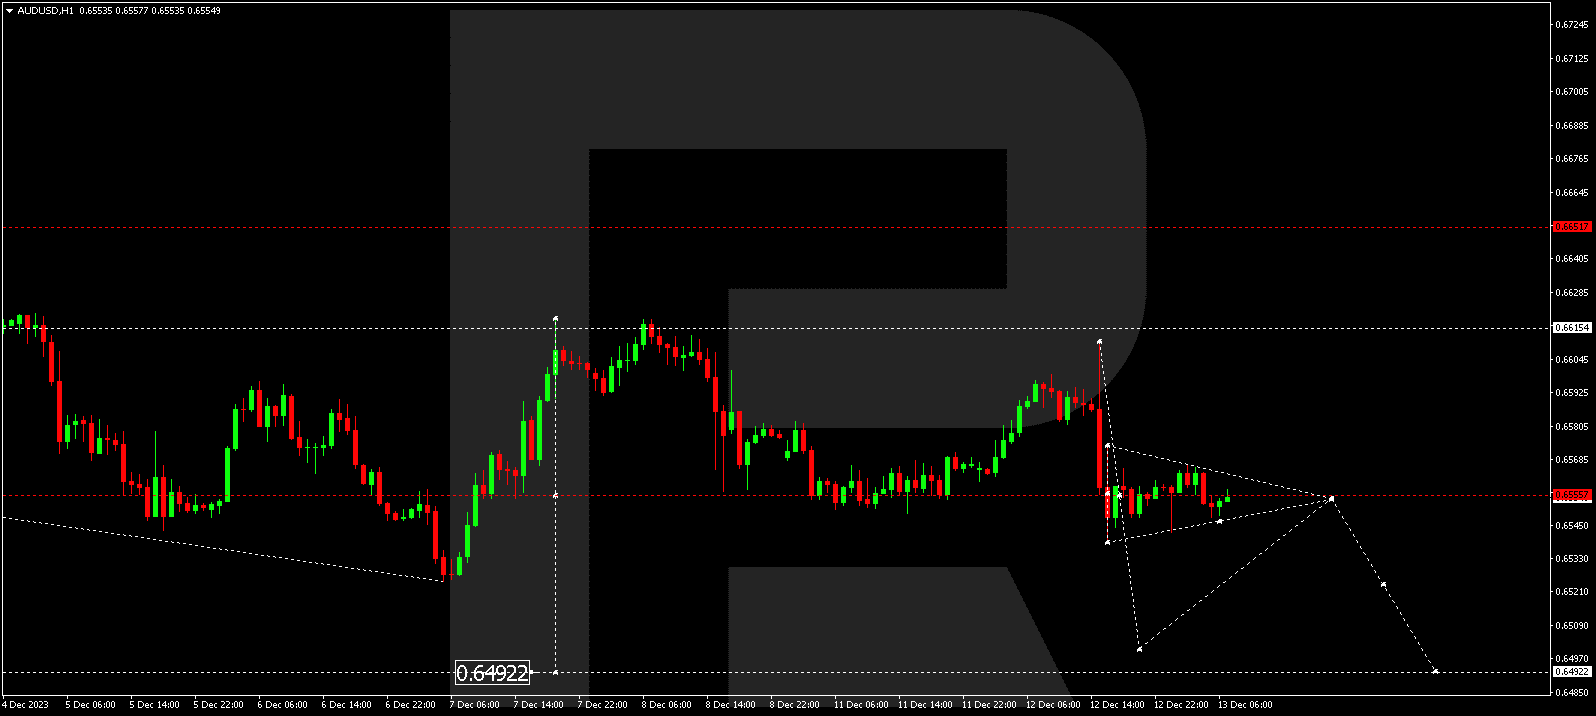
AUD/USD experienced a decline impulse to 0.6539. The market is forming a consolidation range around 0.6555. A downward breakout may lead to a decline to 0.6500, followed by a potential upward link to 0.6555 (a test from below), and then a decrease to 0.6490. This is the first target.
BRENT
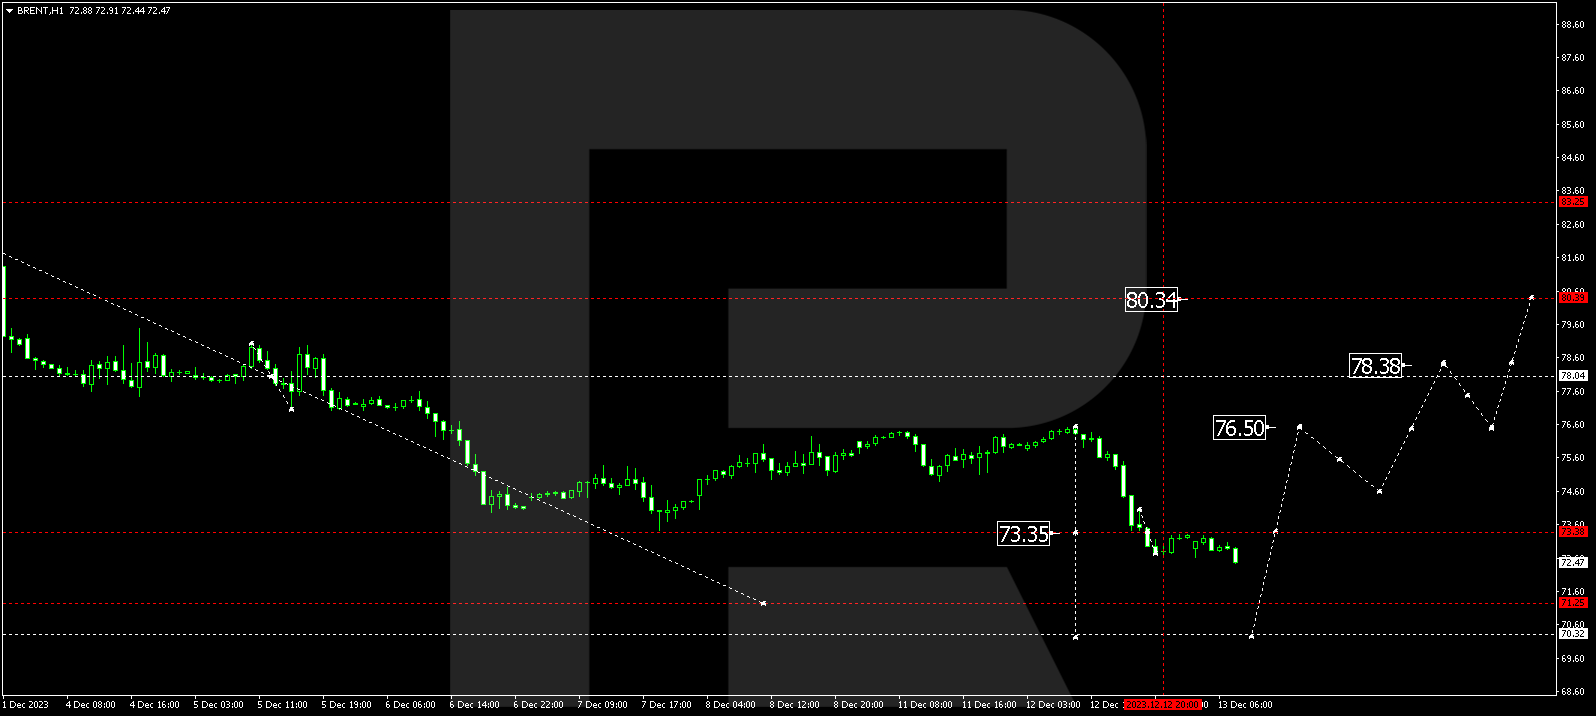
Brent formed a consolidation range around 73.40. A potential downward breakout from the range could lead to a wave extension to 70.40. After reaching this level, a new growth wave to 76.50 might develop, extending the trend to 80.40. This represents the first target.
XAU/USD (Gold vs US Dollar)
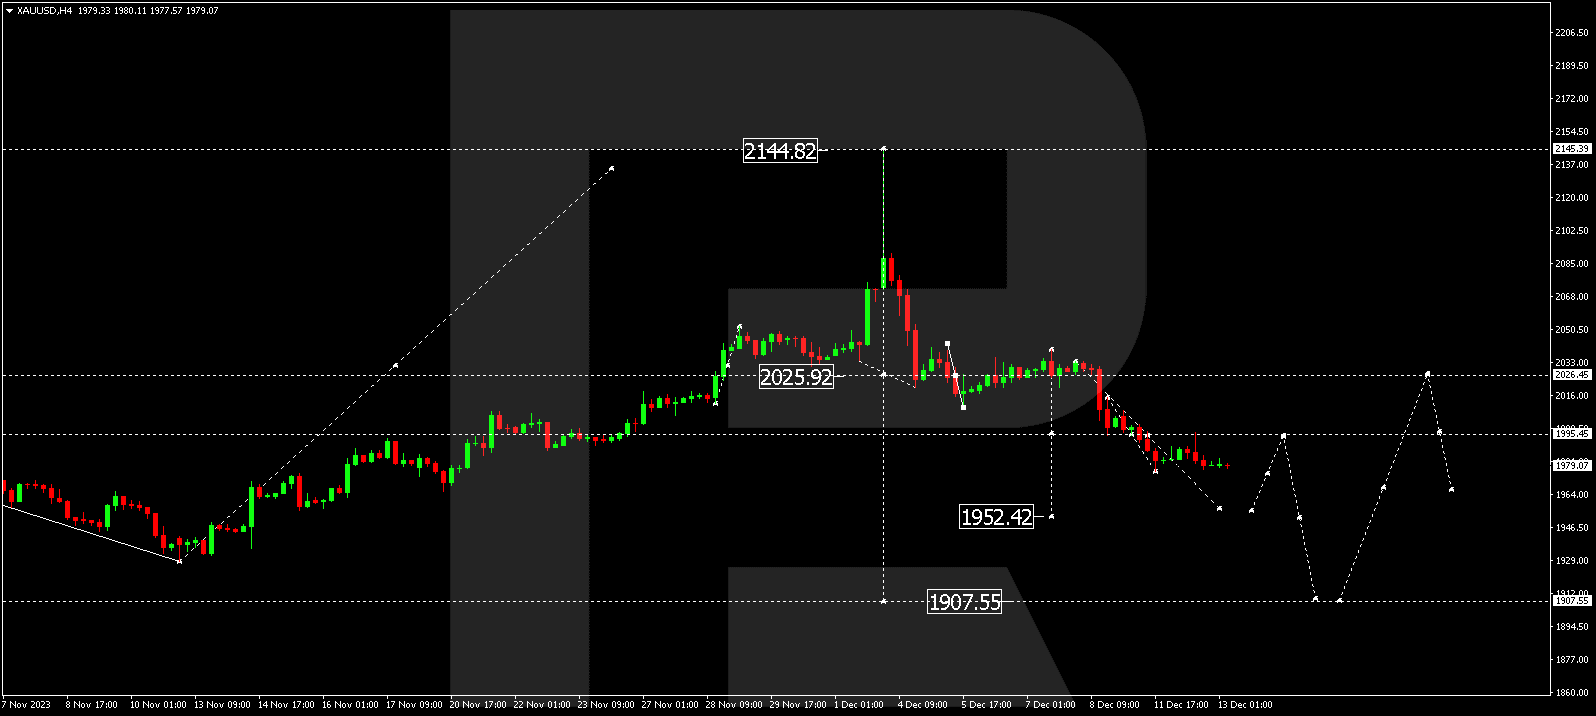
Gold completed a correction wave to 1995.45 (a test from below). A potential continuation of the decline structure could lead to 1952.42, with the trend extending to 1907.55. This is the first target.
S&P 500
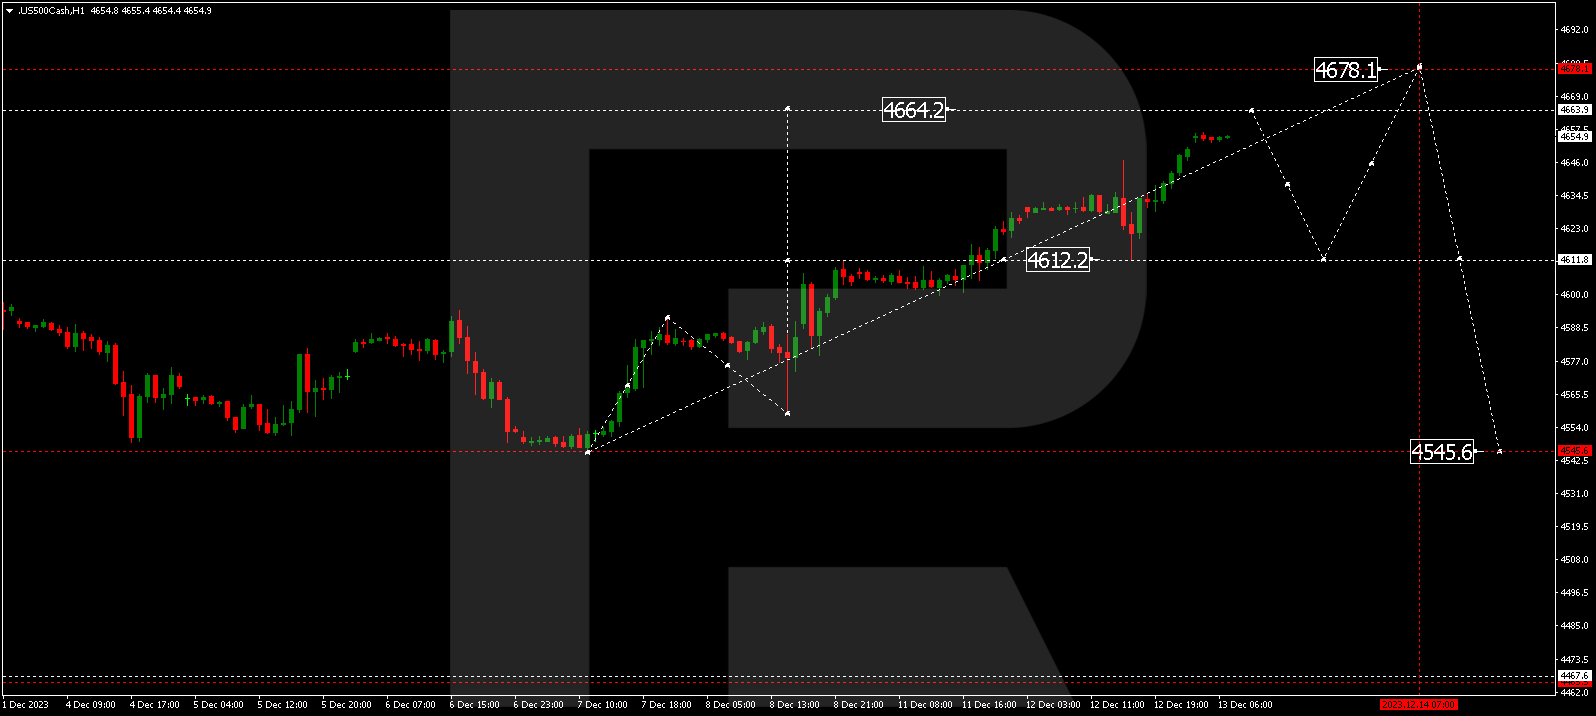
The stock index corrected to 4612.2 (a test from above) and performed a growth link to 4656.0 today. A potential decline link to 4638.8 is not excluded. Following this, quotes might rise to 4663.9, marking a local target. It’s essential to note that the entire growth structure is interpreted as an extension of the growth wave, and at any moment, the market could initiate a steep decline to 4545.0.
The post Technical Analysis & Forecast December 13, 2023 appeared first at R Blog – RoboForex.