
JPY May Extend Corrective Wave. The overview also details the dynamics of EUR, GBP, CHF, AUD, Brent, Gold, and the S&P 500 index.
EUR/USD (Euro vs US Dollar)
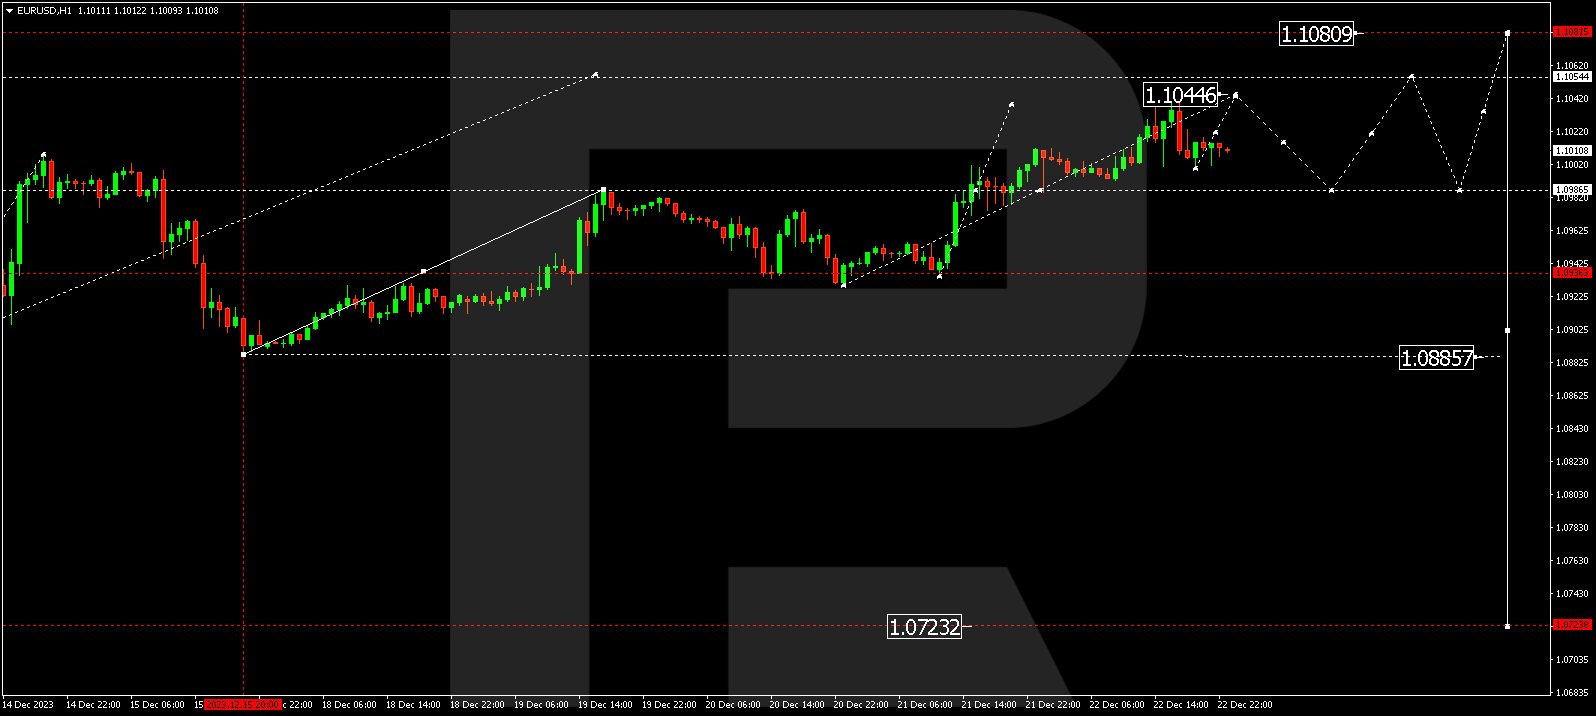
EUR/USD is in the midst of a growth wave targeting 1.1040. Upon reaching this level, a corrective phase to 1.0986 might unfold (a test from above). Following this, an ascent to 1.1055 is anticipated, potentially followed by a new decline wave to 1.0888.
GBP/USD (Great Britain Pound vs US Dollar)
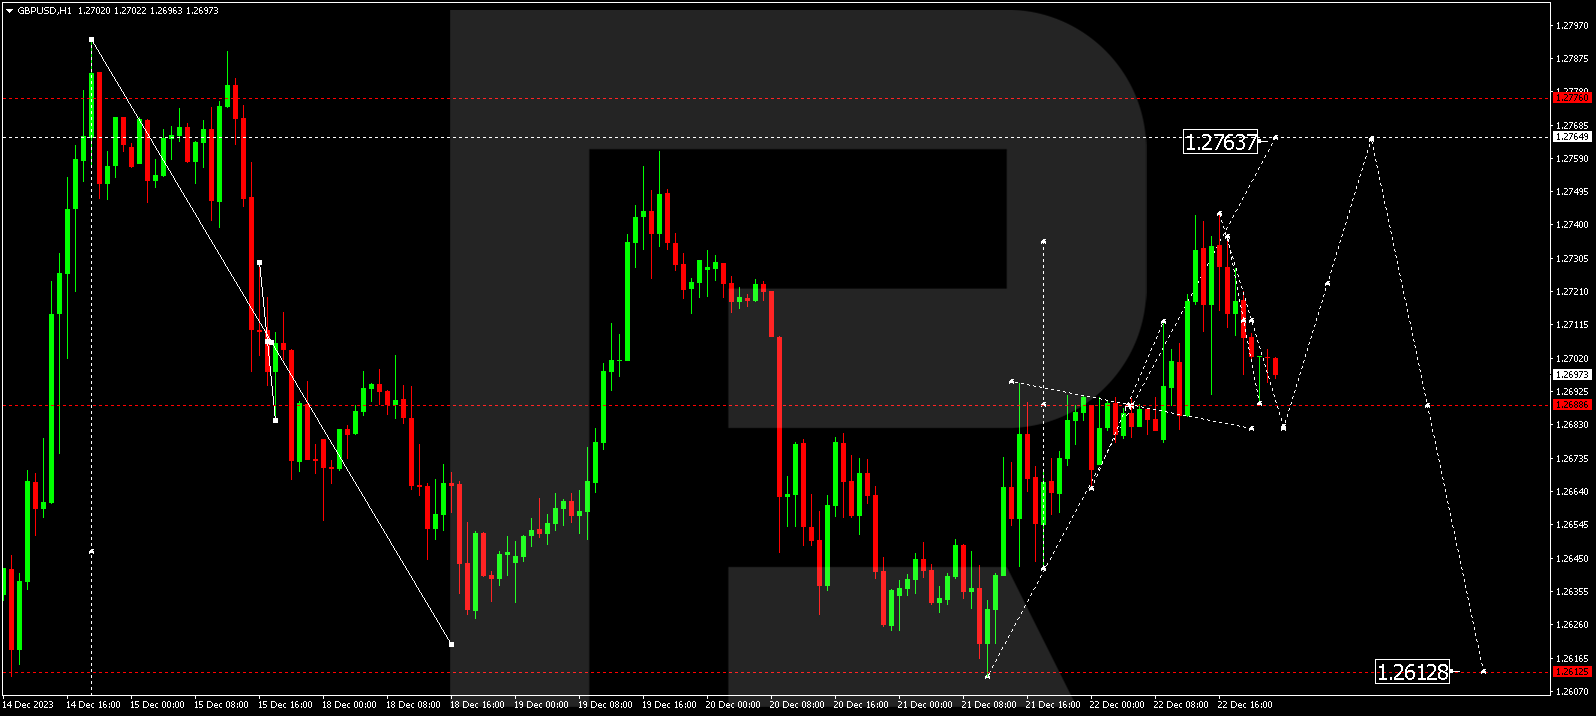
GBP/USD may continue its correction to 1.2683. After the correction, the price could ascend to 1.2764. Subsequently, a decline wave to 1.2613 might commence, extending the trend to 1.2600.
USD/JPY (US Dollar vs Japanese Yen)
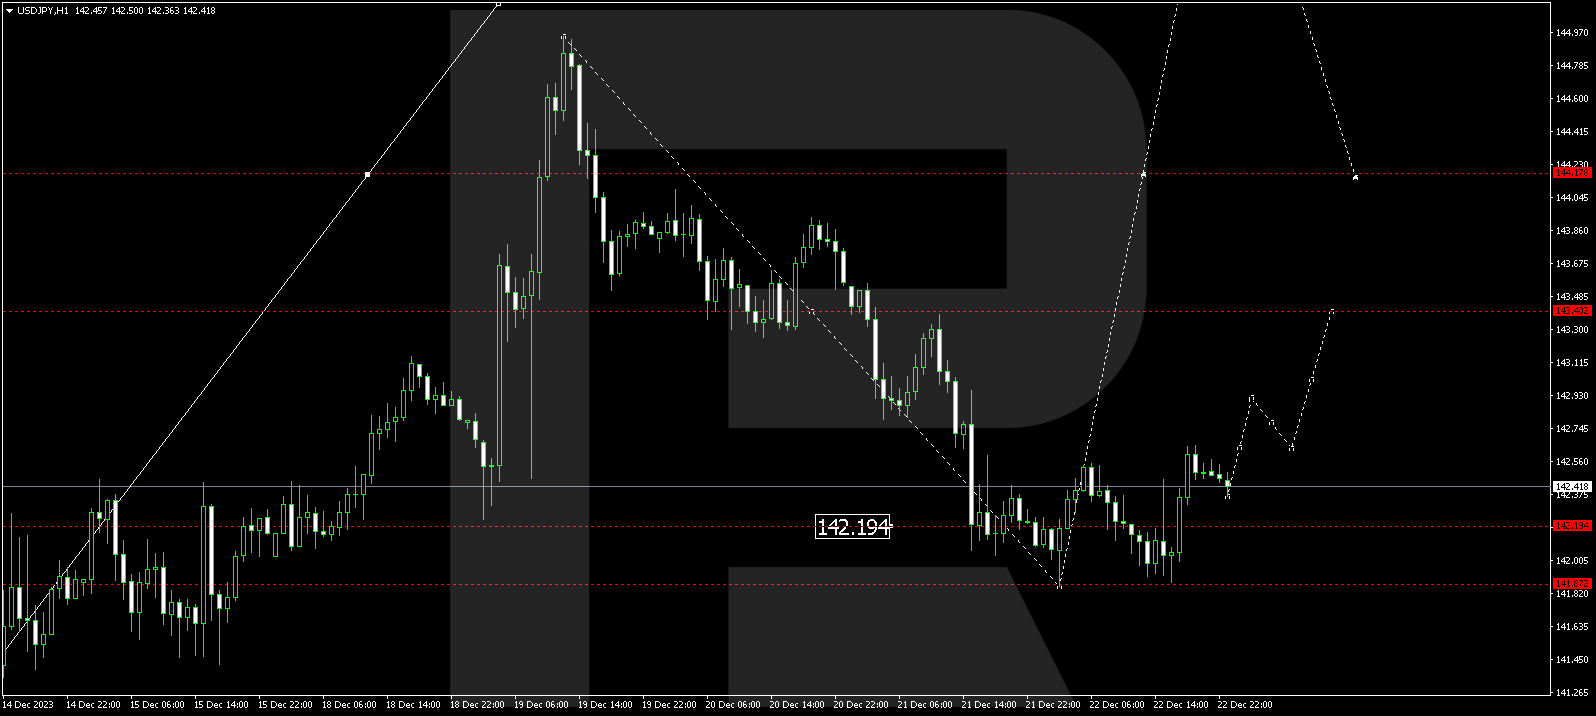
USD/JPY is within a consolidation range around 142.20. An upward escape might trigger a correction to 144.18, while a downward escape opens the potential for a decline to 140.00. This is considered a local target.


USD/CHF (US Dollar vs Swiss Franc)
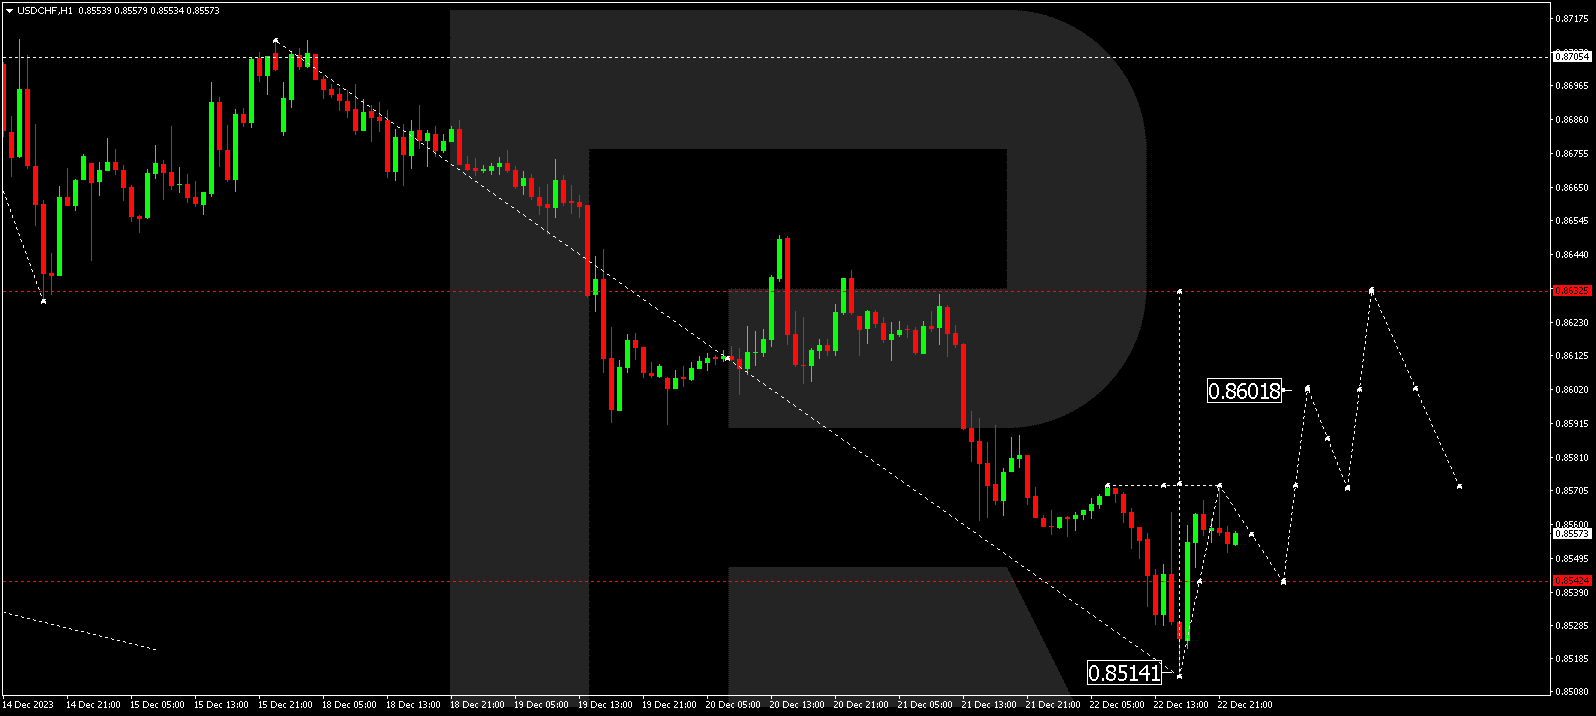
USD/CHF is still correcting towards 0.8544. Next, the instrument could rise to 0.8602, signaling a potential continuation to 0.8633. This marks the initial target.
AUD/USD (Australian Dollar vs US Dollar)
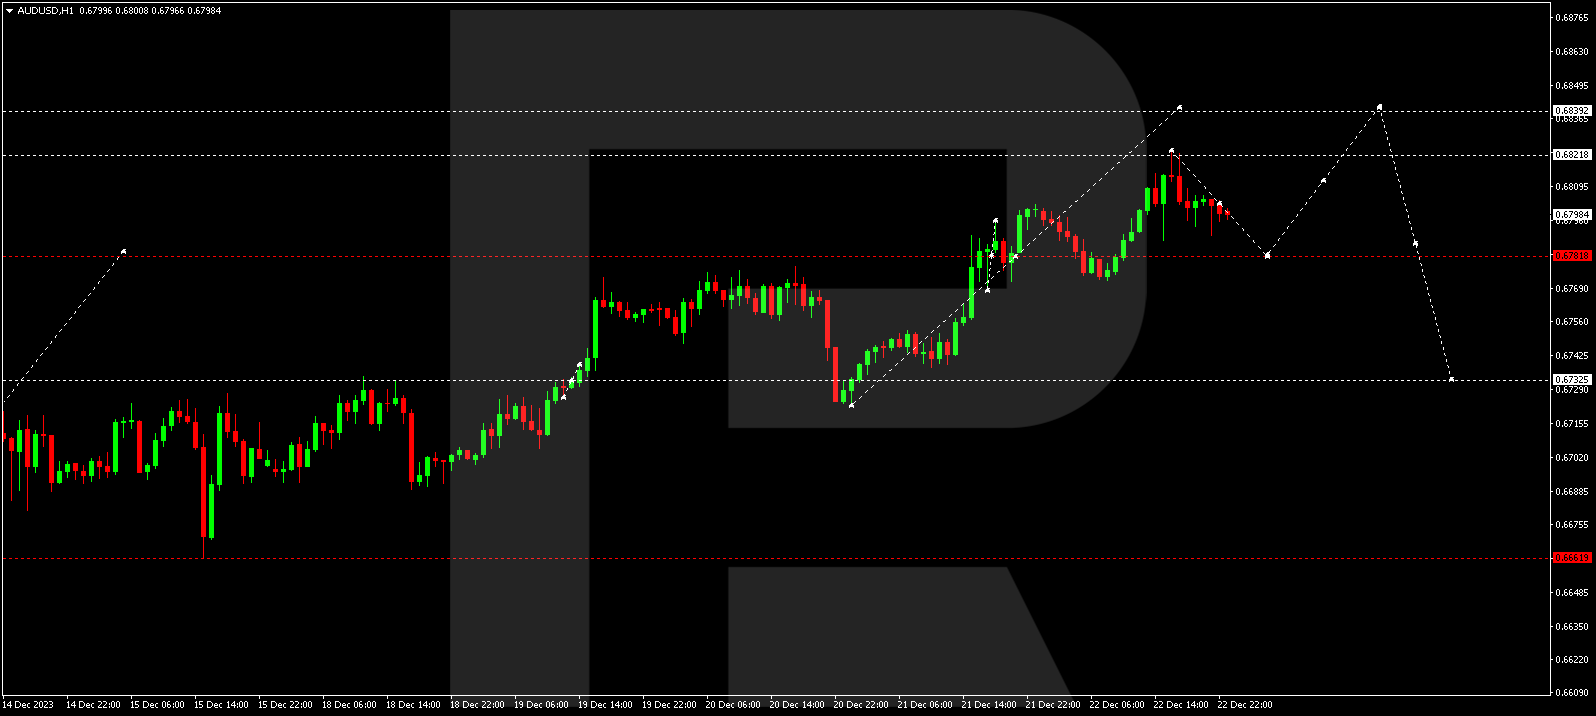
AUD/USD is undergoing a correction to 0.6782. Following the correction, a new growth structure to 0.6840 may commence, succeeded by a decline wave to 0.6733.
BRENT
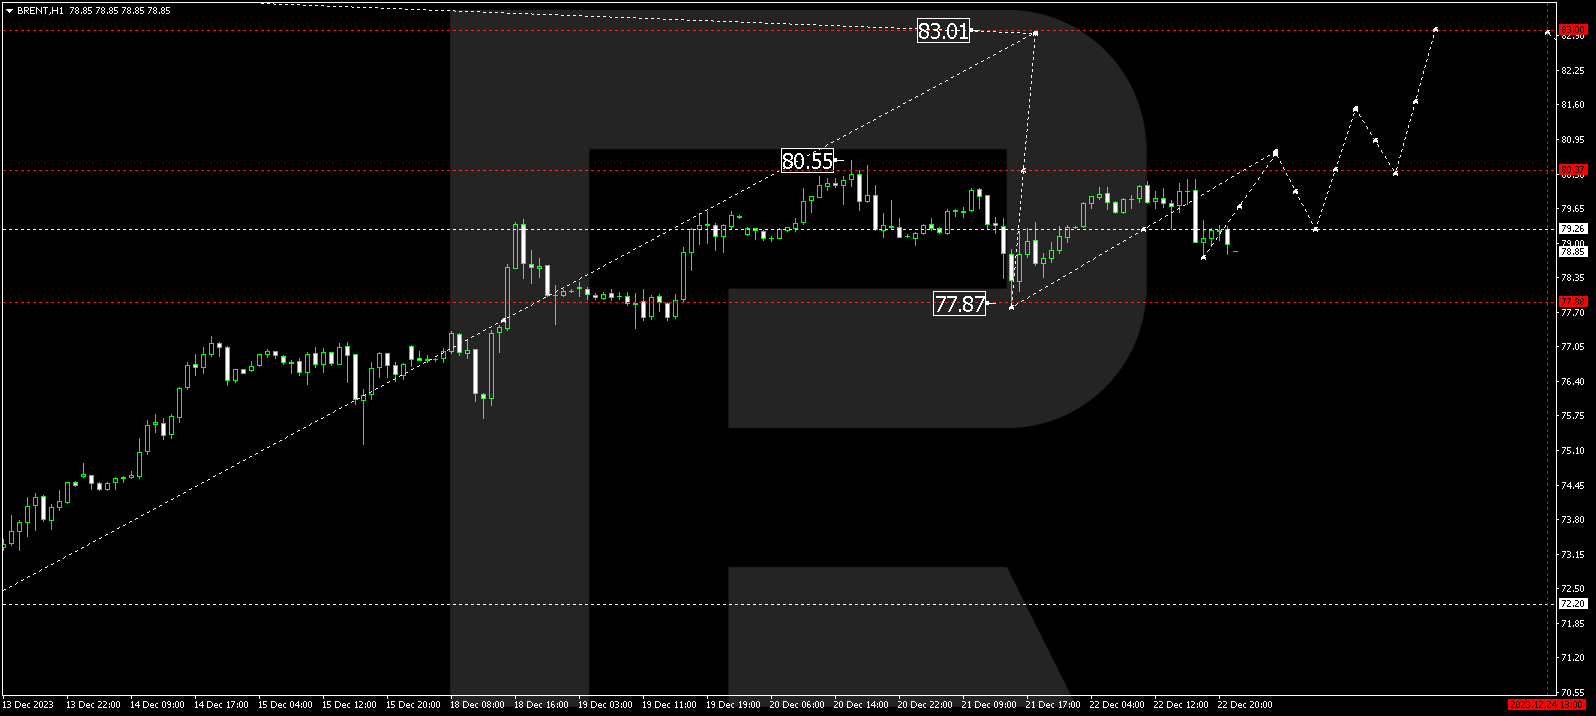
Brent is engaged in a consolidation phase around 79.20. An upward breakout could lead to a growth phase towards 83.00, the first target. Upon reaching this level, a corrective link to 77.80 might initiate (a test from above).
XAU/USD (Gold vs US Dollar)
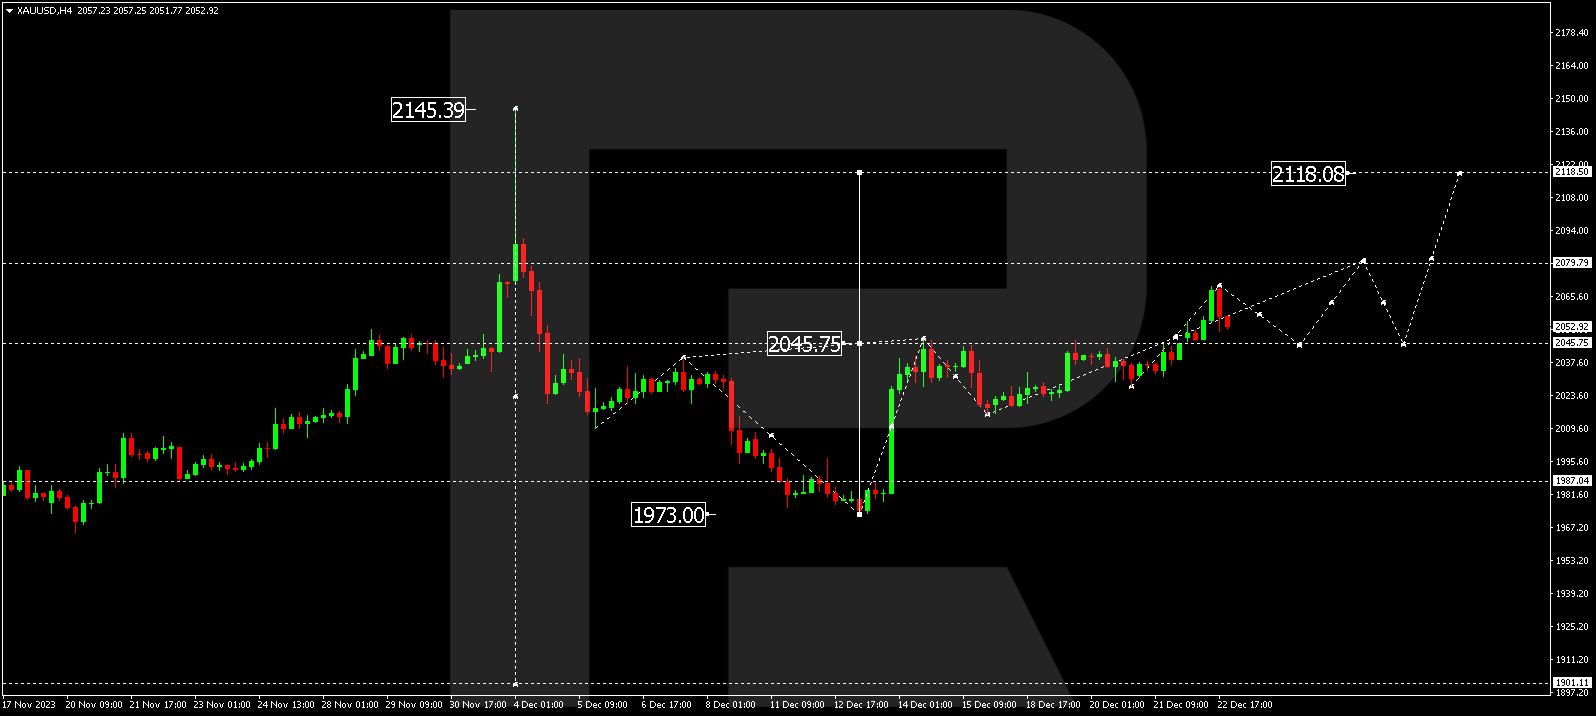
Gold is advancing in a growth wave to 2079.80. After reaching this level, a correction to 2045.75 might follow (a test from above). Subsequently, a growth structure to 2118.00 is anticipated.
S&P 500
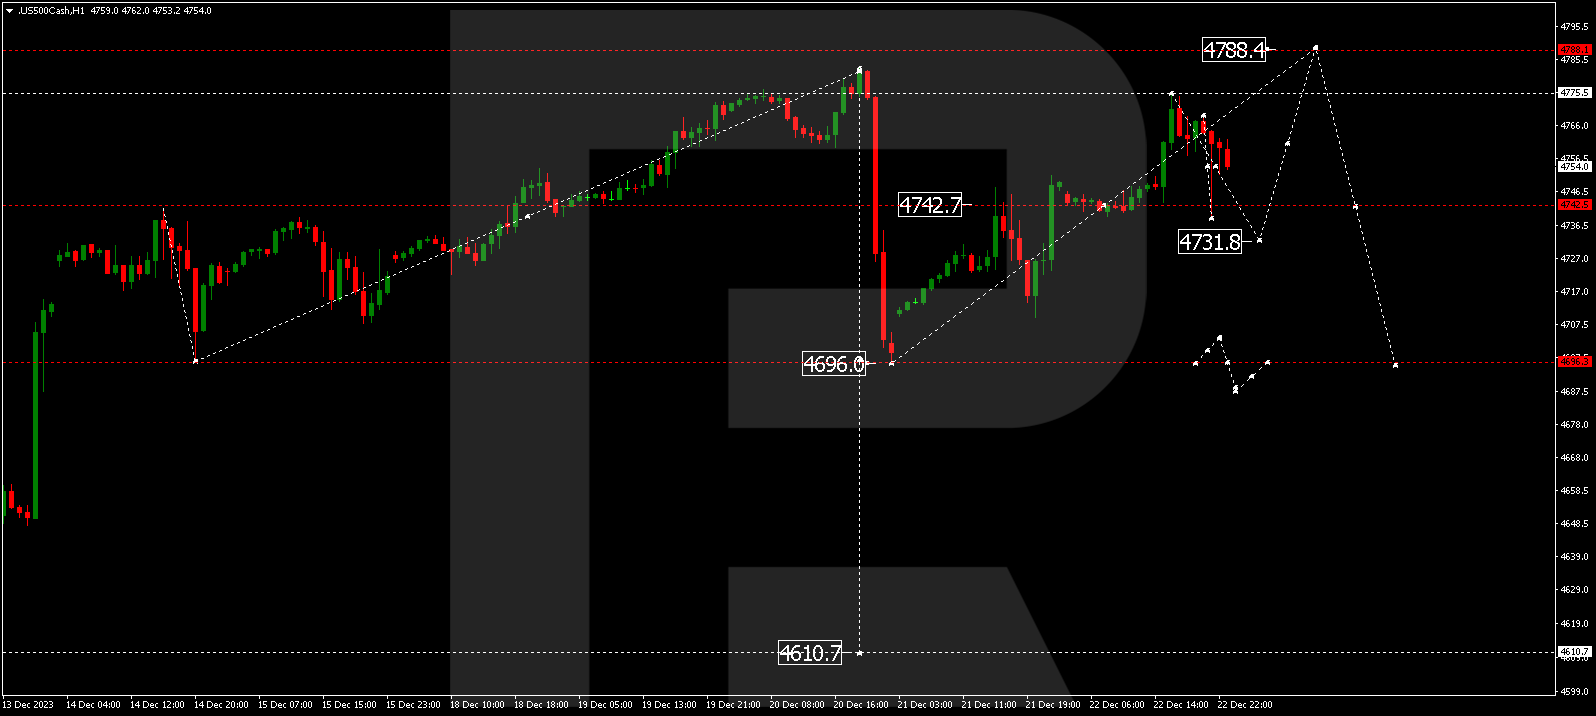
The stock index might undergo an extension of a correction to 4732.0. Following this, a rise to 4788.0 is anticipated. Once this level is reached, a new decline wave to 4696.0 could begin, constituting the first target.
The post Technical Analysis & Forecast December 26, 2023 appeared first at R Blog – RoboForex.