
GBP might extend the decline wave. The overview also encompasses the dynamics of EUR, JPY, CHF, AUD, Brent, Gold, and the S&P 500 index.
EUR/USD (Euro vs US Dollar)
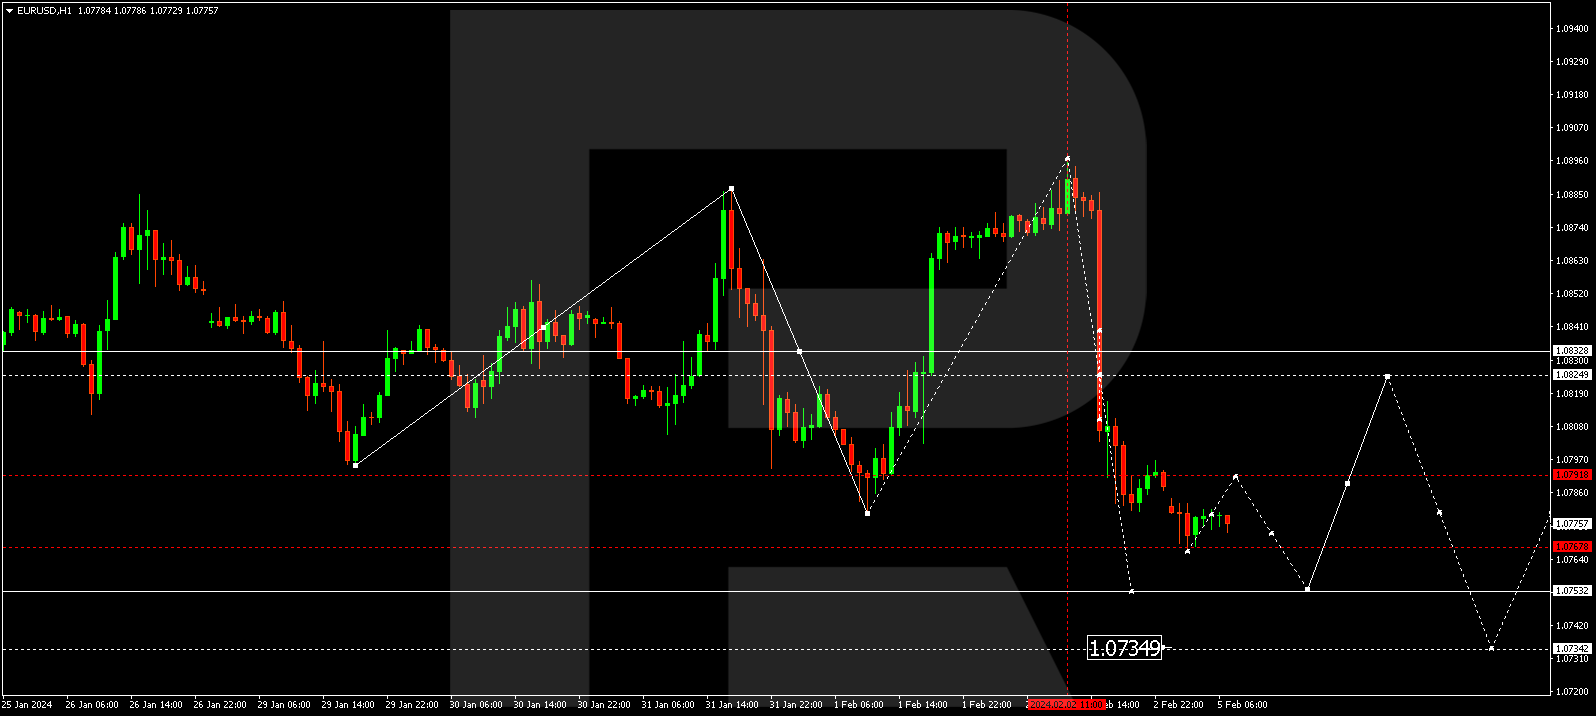
The EUR/USD pair has concluded a corrective wave reaching 1.0896. Currently, the market is in the process of developing a decline wave to 1.0755. After reaching this level, a correction to 1.0792 is plausible, followed by a decrease to 1.0740.
GBP/USD (Great Britain Pound vs US Dollar)
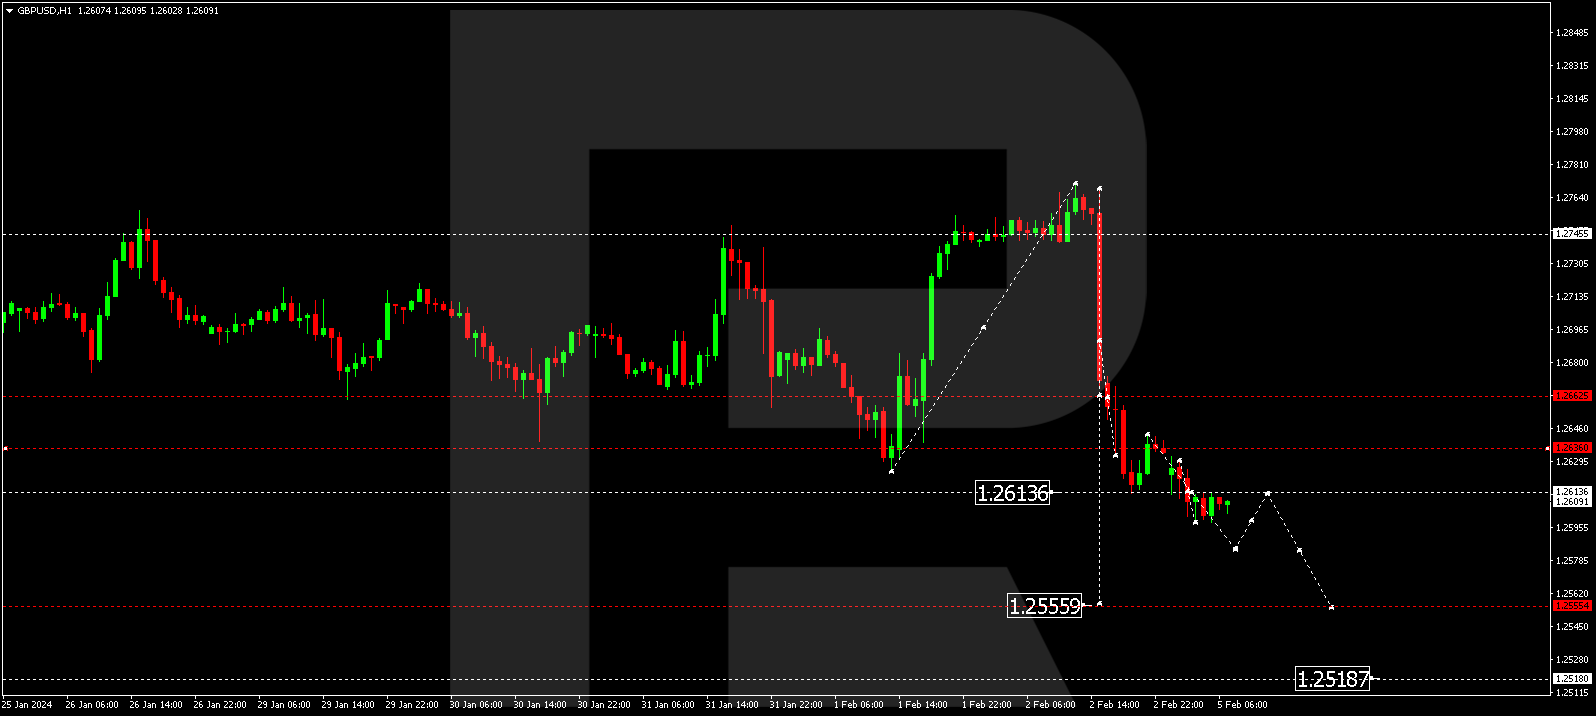
The GBP/USD pair has completed a correction wave to 1.2770. Today, the decline wave might extend to 1.2555. Once this level is reached, a growth link to 1.2614 could form, followed by a decline to 1.2520.
USD/JPY (US Dollar vs Japanese Yen)
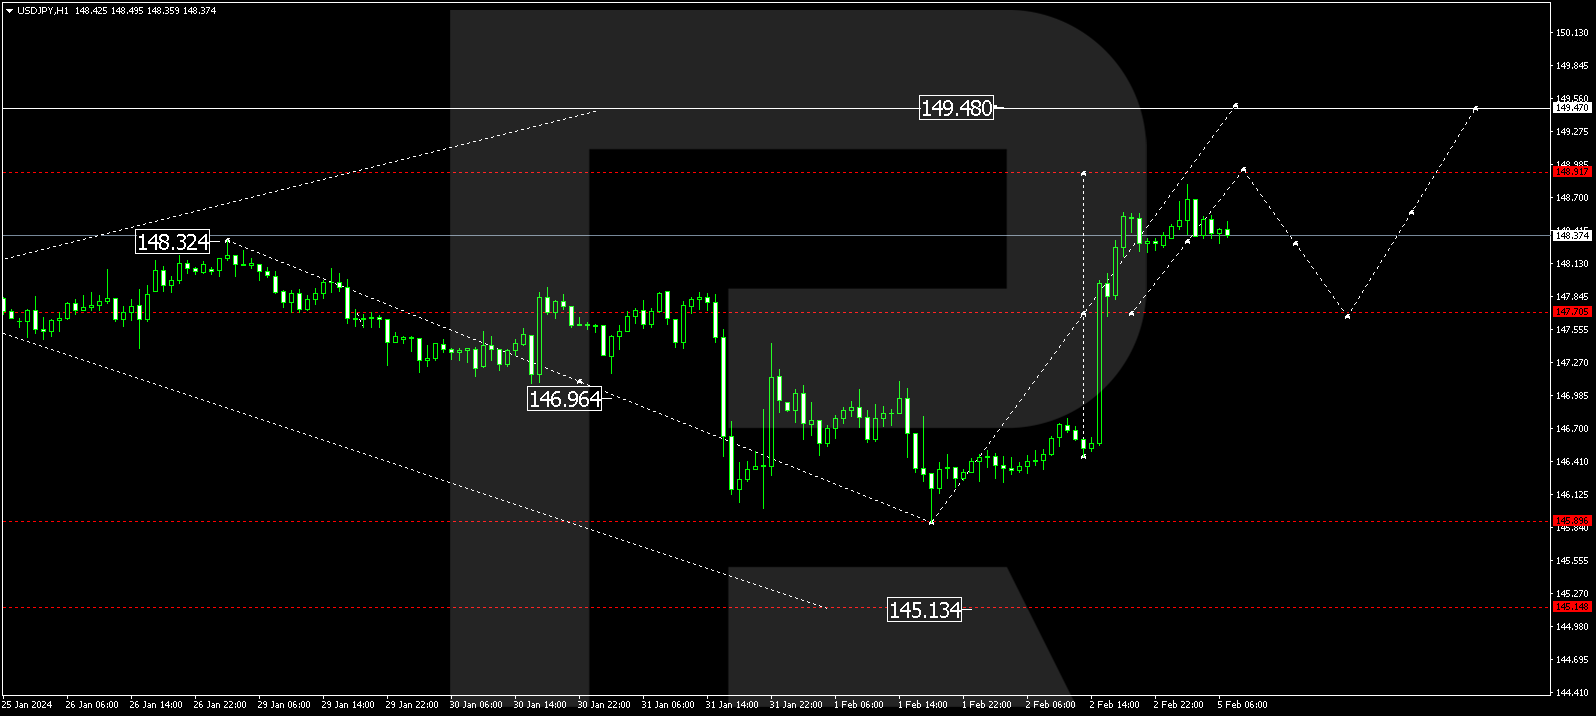
The USD/JPY pair has corrected to 145.90, and today the growth wave might extend to 148.92. After reaching this level, a correction link to 147.70 is not excluded, followed by a rise to 149.47.


USD/CHF (US Dollar vs Swiss Franc)
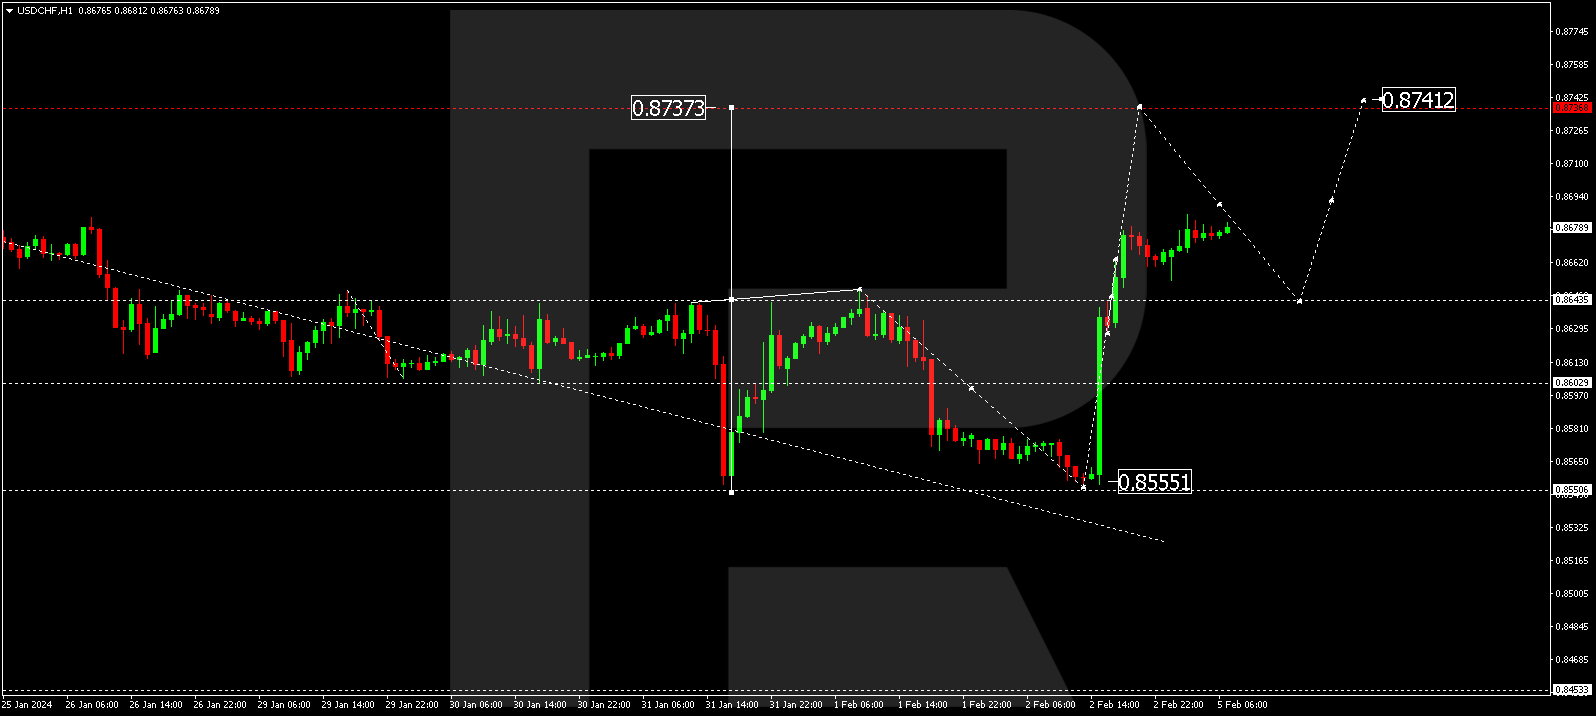
The USD/CHF pair has corrected to 0.8555. Today, the market is forming the structure of a new growth wave to 0.8700. Subsequently, a correction link to 0.8650 is not excluded, followed by a rise to 0.8741.
AUD/USD (Australian Dollar vs US Dollar)
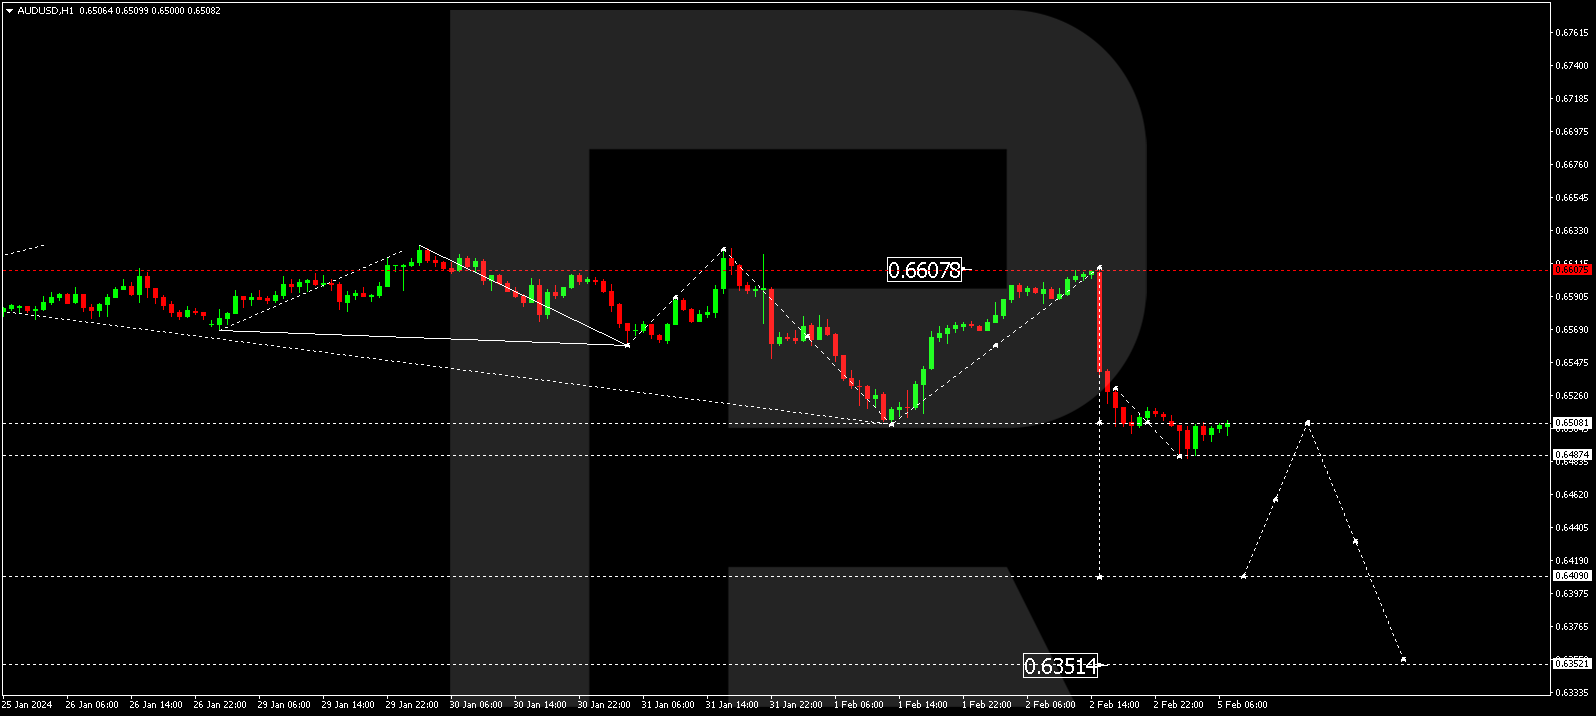
The AUD/USD pair has completed a growth wave to 0.6607. Today, the market continues developing a decline wave to 0.6410. After reaching this level, a correction link to 0.6509 is not excluded. Next, a new decline wave to 0.6355 could commence.
BRENT
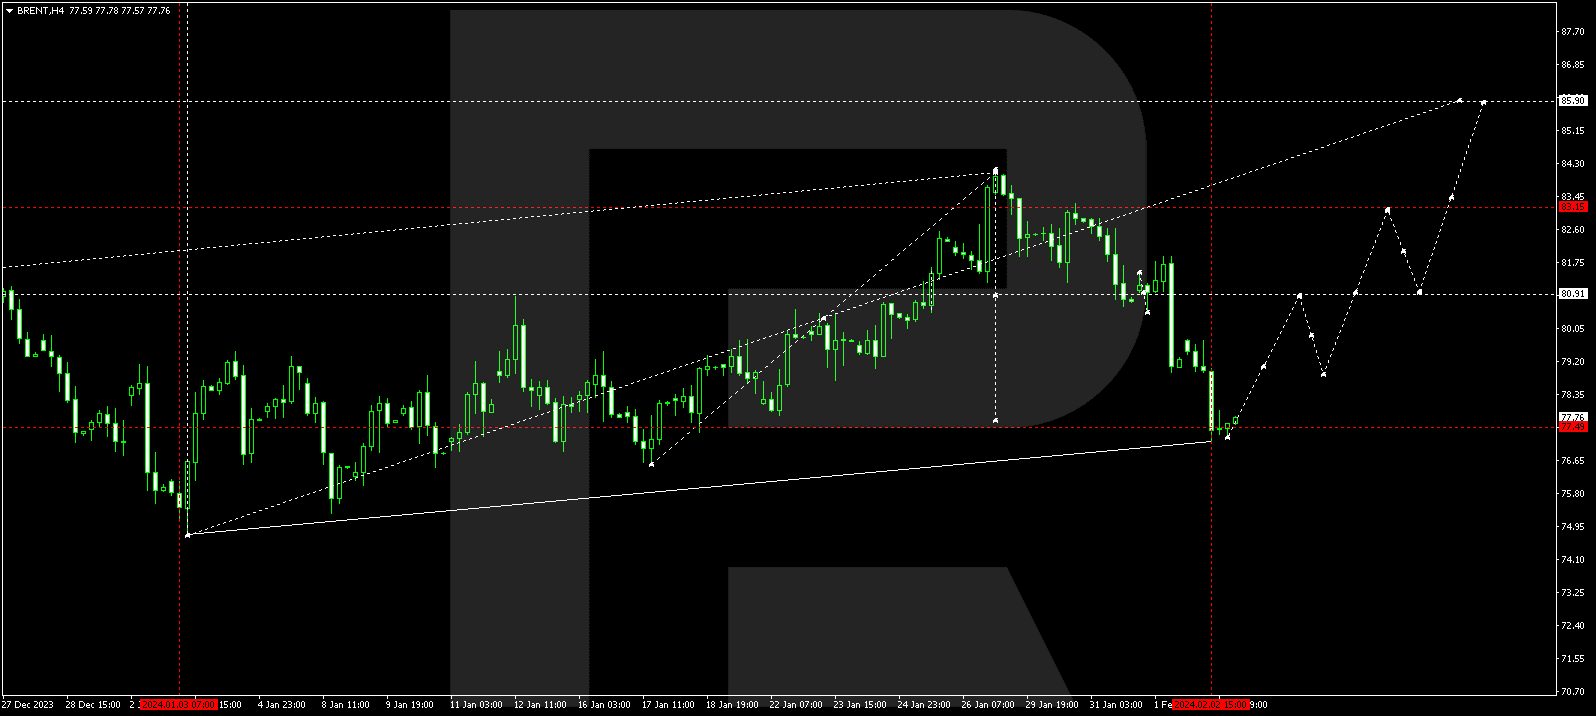
Brent has completed a correction wave to 77.22. A consolidation range could form above this level today. With an escape from the range upwards, a new growth wave to 80.90 might commence. If this level also breaks, the wave could extend to 85.90. This is the first target.
XAU/USD (Gold vs US Dollar)
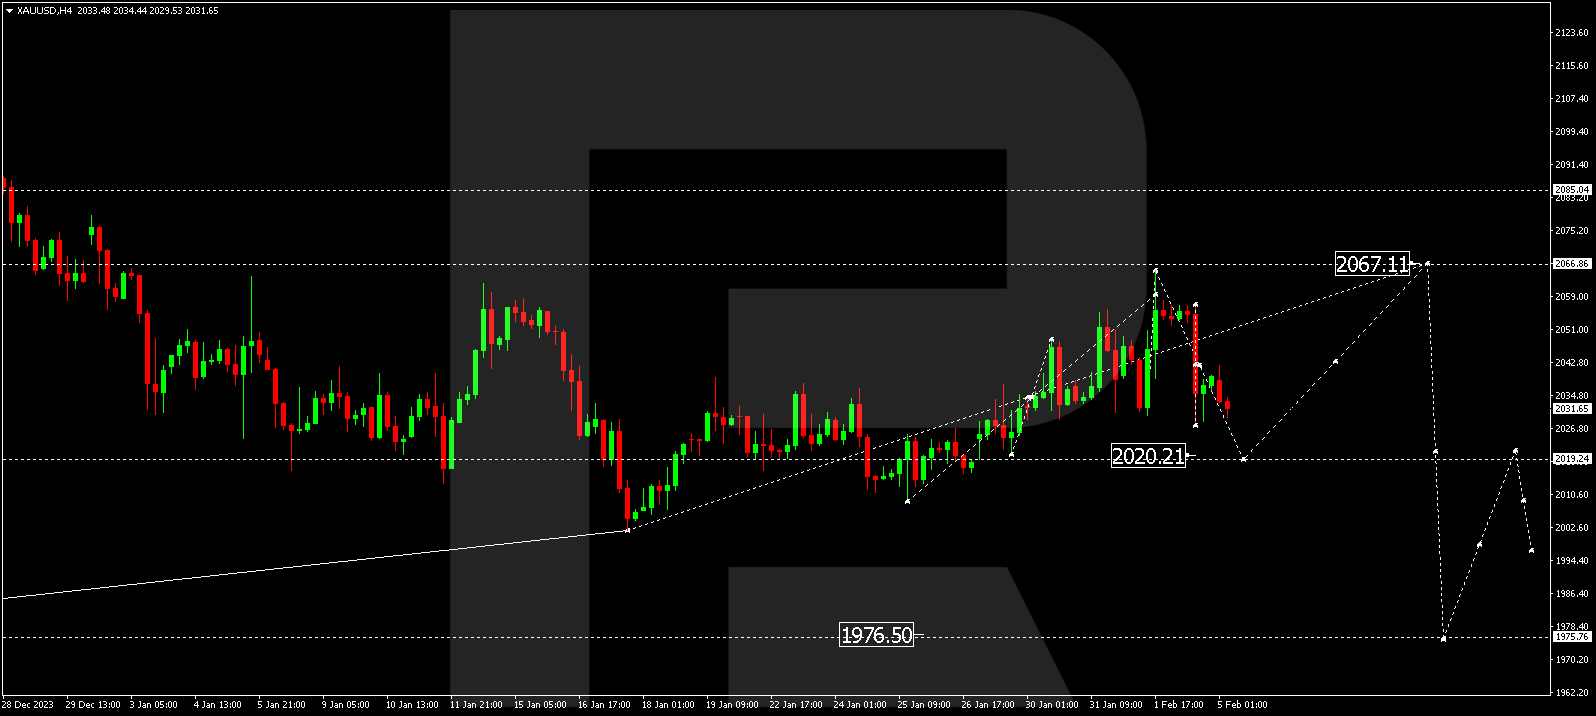
Gold continues developing a decline wave to 2020.20. After reaching this level, a growth link to 2067.11 is not excluded, followed by a decline to 1976.55. This is a local target.
S&P 500
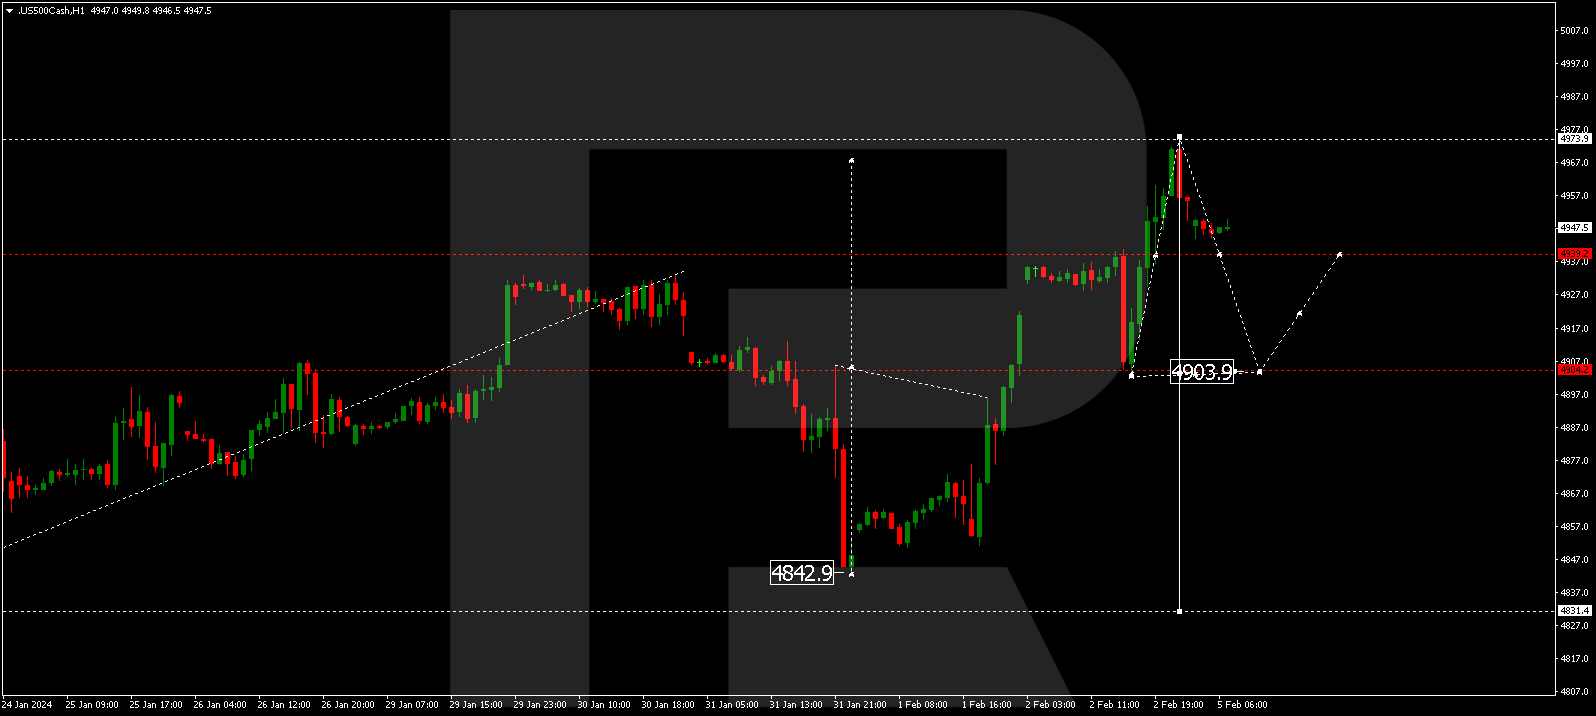
The stock index has completed a growth wave to 4973.9. A decline to 4903.9 might follow today. Subsequently, the market might form a correction to 4939.9 and a decline to 4831.5. This is the first target.
The post Technical Analysis & Forecast February 05, 2024 appeared first at R Blog – RoboForex.