
Gold is in a correction phase. The overview also covers the dynamics of EUR, GBP, JPY, CHF, AUD, Brent, and the S&P 500 index.
EUR/USD (Euro vs US Dollar)
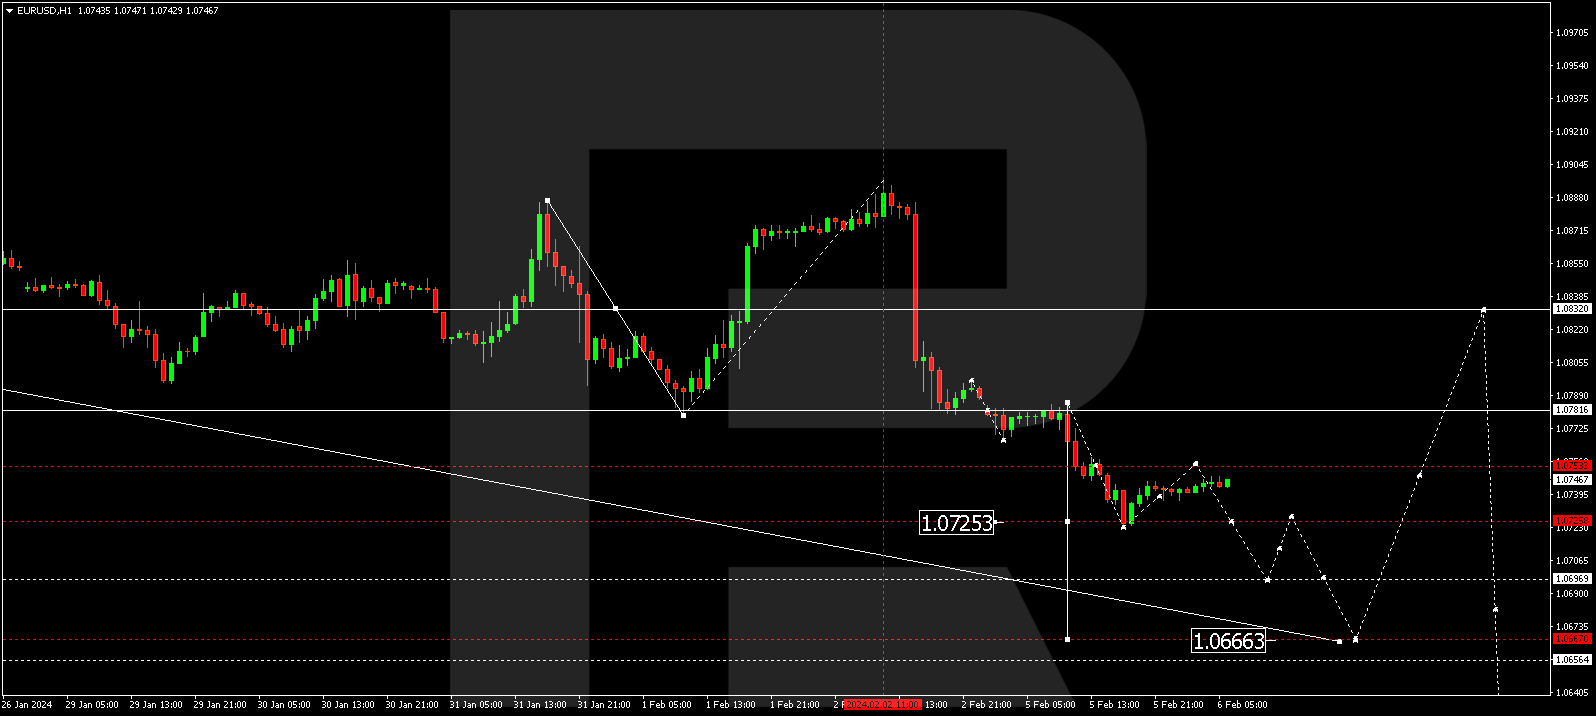
EUR/USD has concluded a decline wave, reaching 1.0722. Today, the pair may undergo a correction to 1.0753. Once this corrective phase concludes, a fresh decline wave to 1.0720 might initiate. If this level is breached, the potential for a further descent to 1.0696 could materialize. This marks a local target.
GBP/USD (Great Britain Pound vs US Dollar)
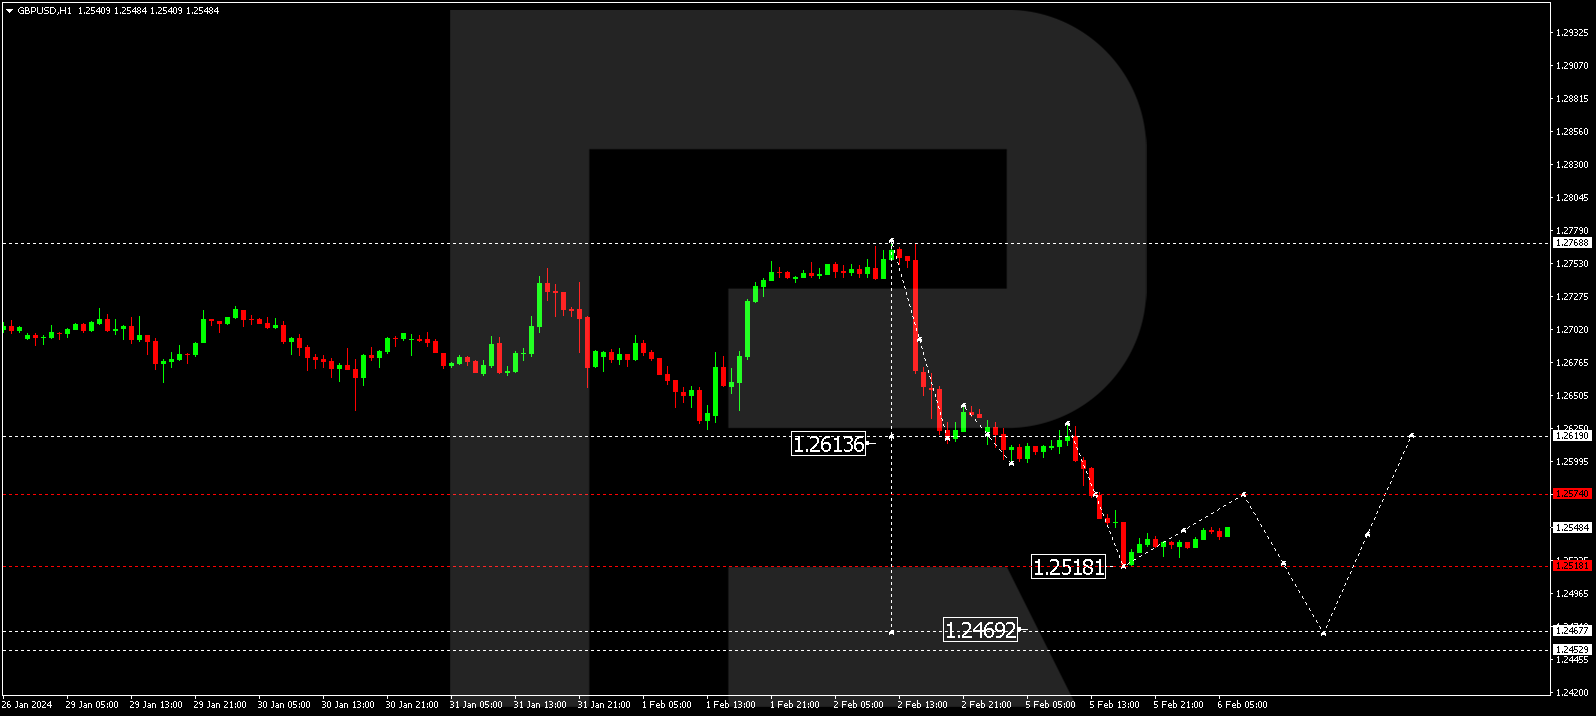
GBP/USD has completed a decline wave to 1.2518. Today, a correction to 1.2574 is plausible. After the correction concludes, a new decline wave to 1.2470 might commence. This constitutes a local target.
USD/JPY (US Dollar vs Japanese Yen)
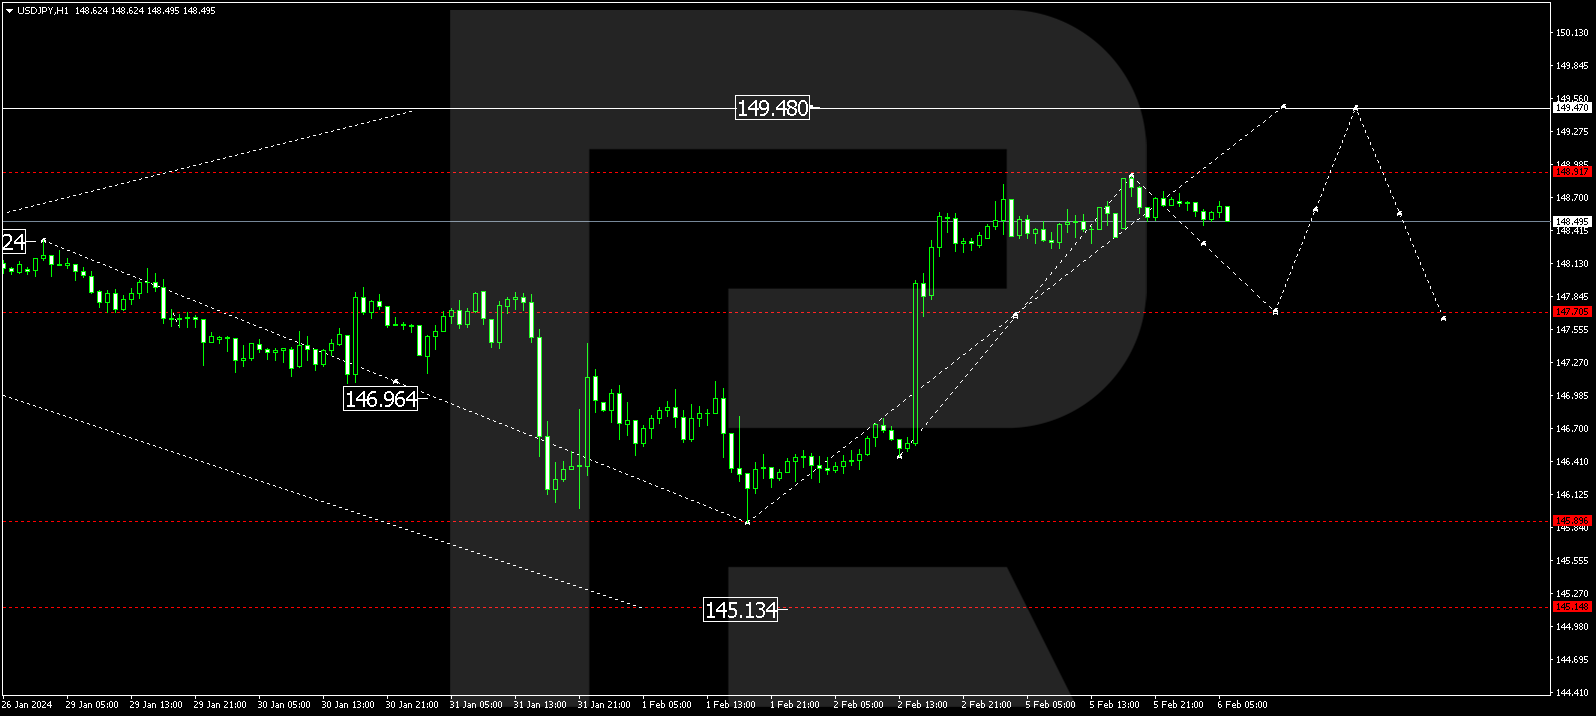
USD/JPY has wrapped up a growth wave to 148.89. Presently, the market is shaping a consolidation range below this level. An escape downward could lead to a correction to 147.77, while an upward breakout might pave the way for a rise to 149.47.


USD/CHF (US Dollar vs Swiss Franc)
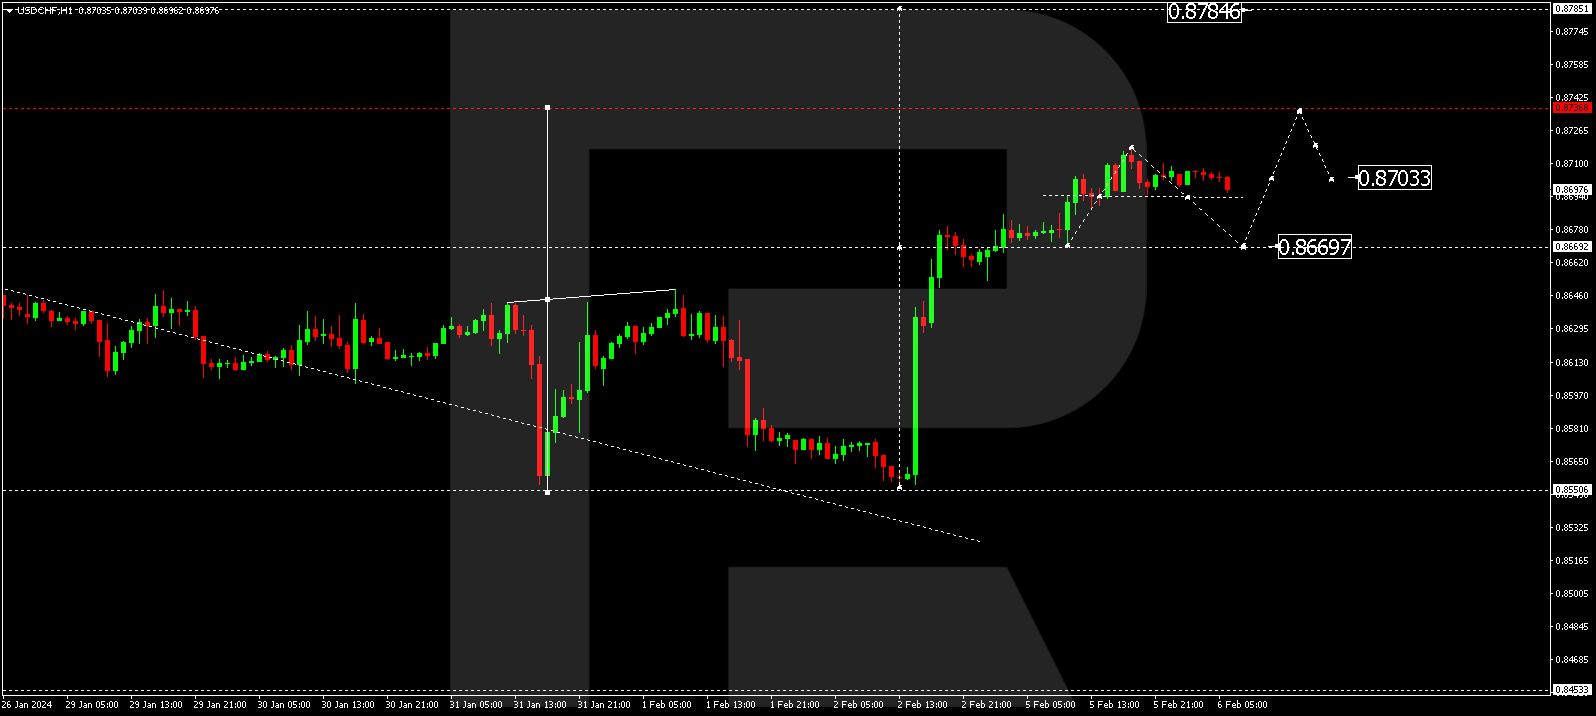
USD/CHF has completed a growth wave to 0.8717. Currently, the market is constructing a consolidation range below this level. A potential downward breakout for a correction to 0.8666 cannot be ruled out. Conversely, an upward breakout may open the door to a growth wave to 0.8737, from where the trend might extend to 0.8787.
AUD/USD (Australian Dollar vs US Dollar)
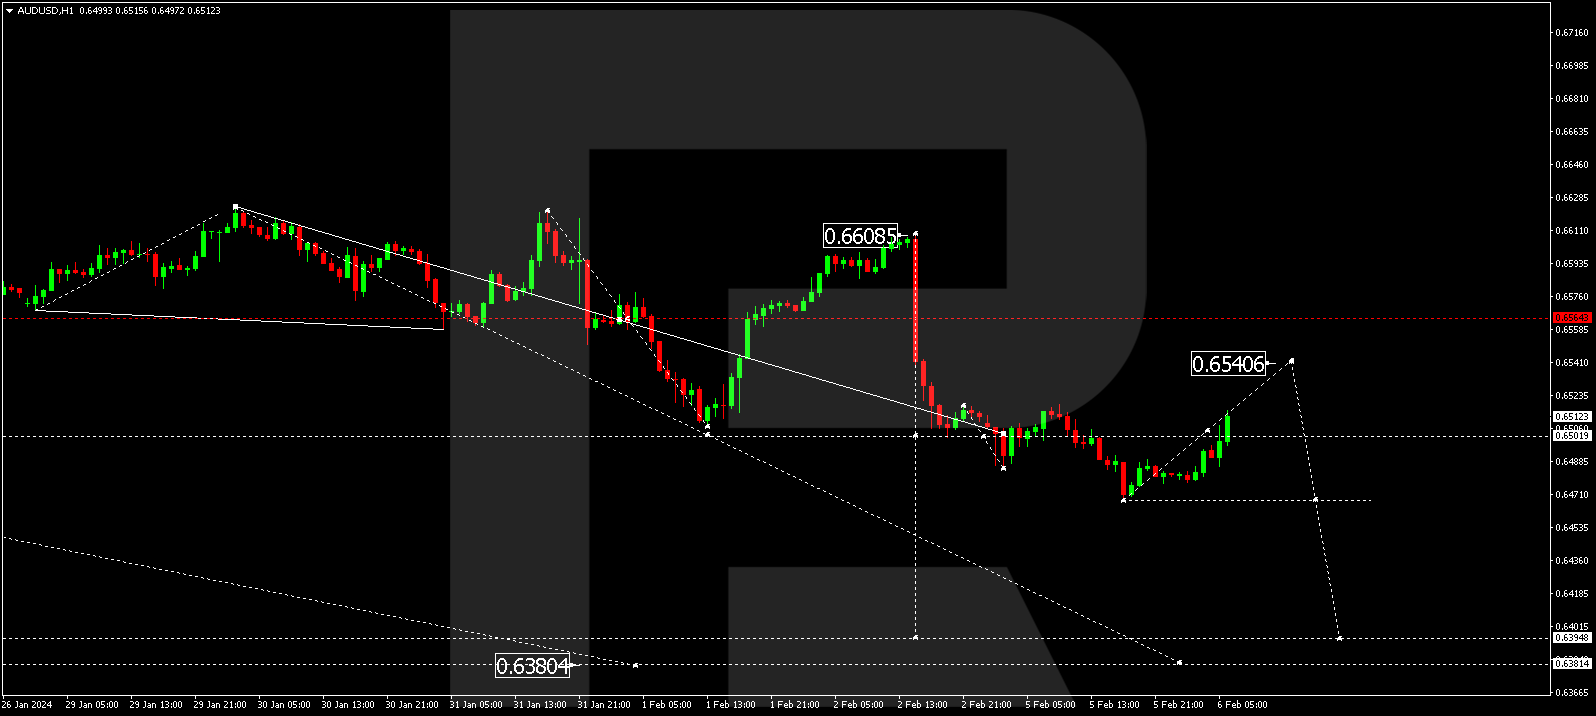
AUD/USD has concluded a decline wave to 0.6468. A potential correction to 0.6540 is on the horizon. Post-correction, the decline wave might extend to 0.6470, initiating a potential continuation of the trend to 0.6394.
BRENT
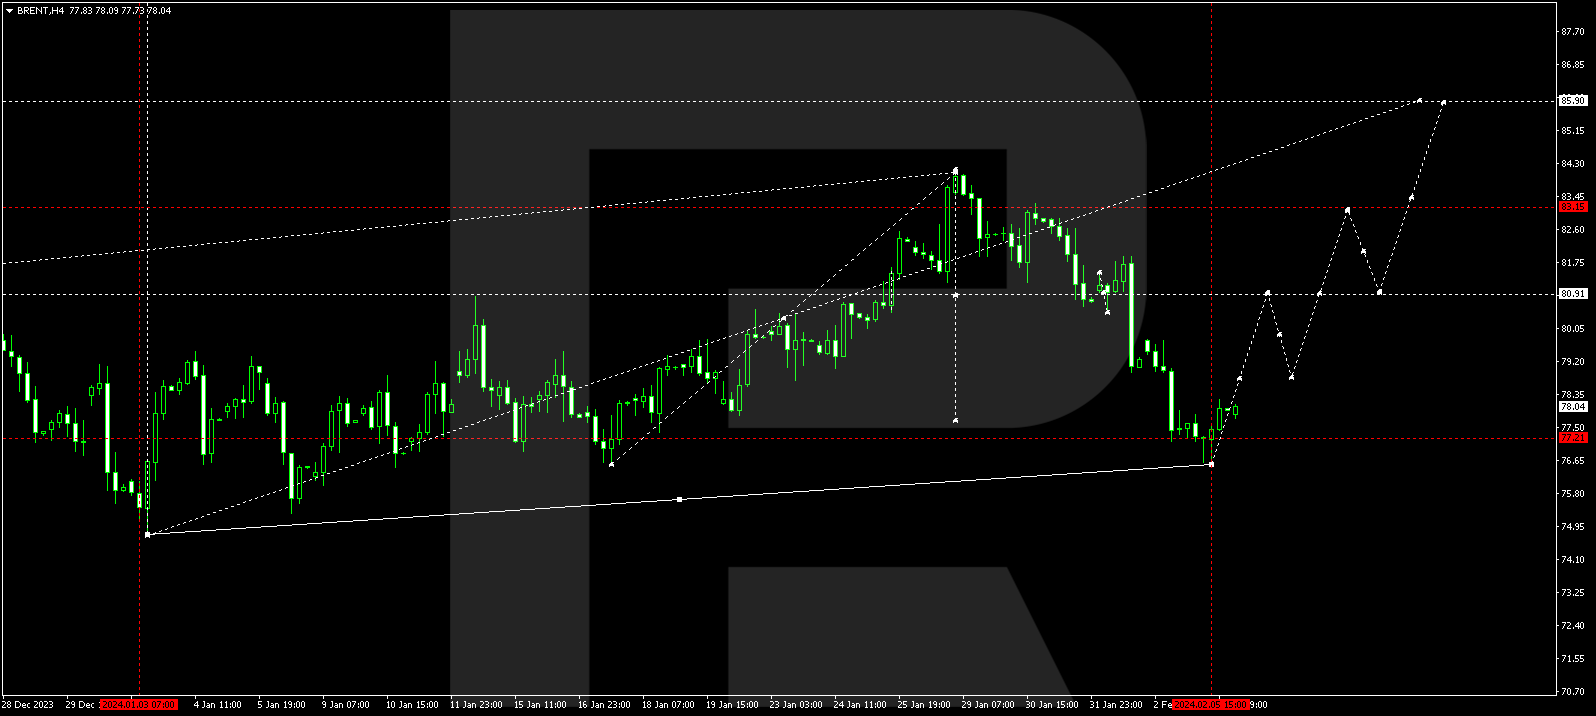
Brent is persisting in a consolidation range around 77.22. An upward breakout could propel the growth wave to 80.90, constituting the initial target. Subsequently, a decline to 79.00 followed by a rise to 83.15 might ensue, paving the way for a potential continuation of the trend to 85.90.
XAU/USD (Gold vs US Dollar)
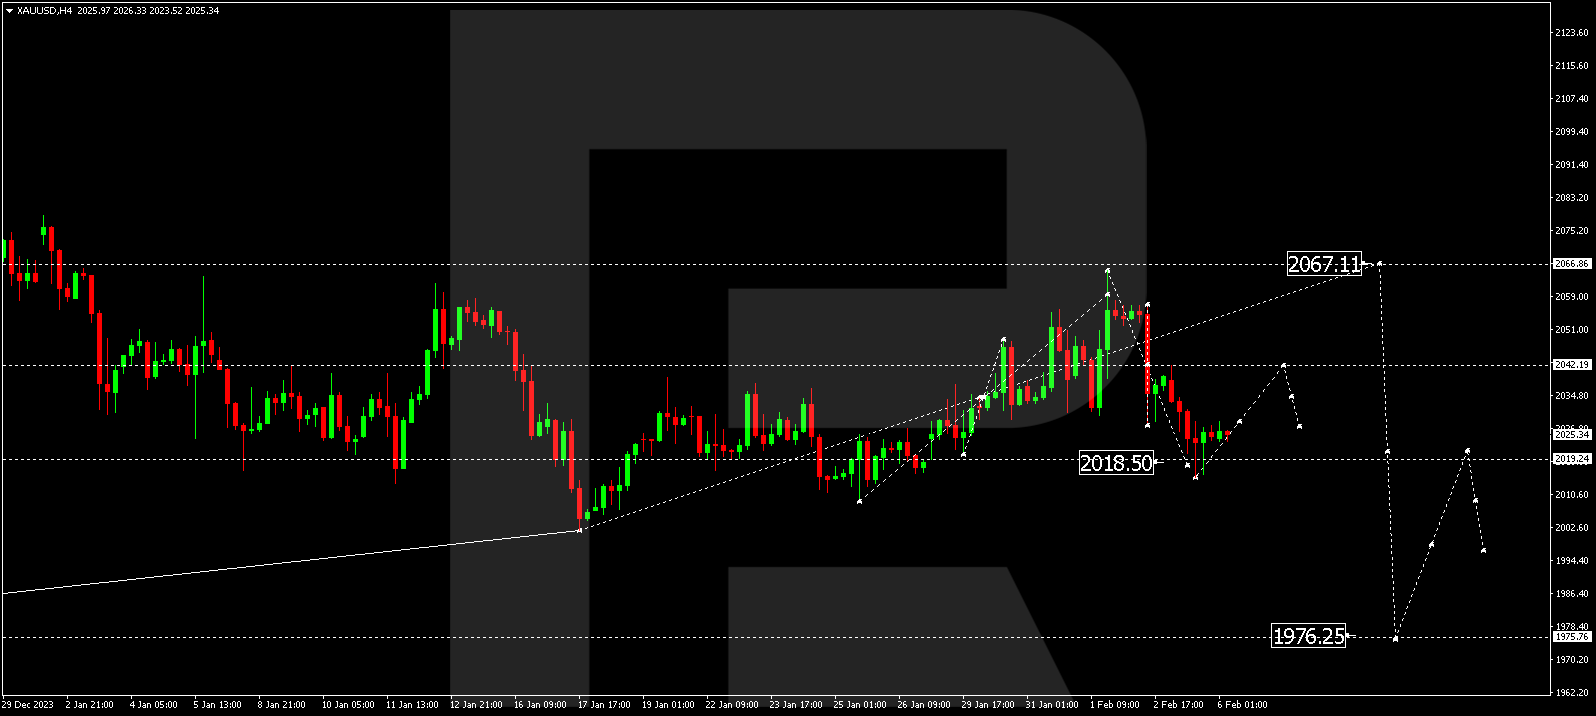
Gold has finalized a decline wave to 2015.00, with a potential correction to 2042.20 anticipated today. After the correction, a fresh decline wave to 2025.00 might unfold. A consolidation range could materialize around 2025.00. An upward breakout may lead to a growth wave to 2067.11, while a downward breakout could result in a decline wave to 2002.00, constituting a local target.
S&P 500
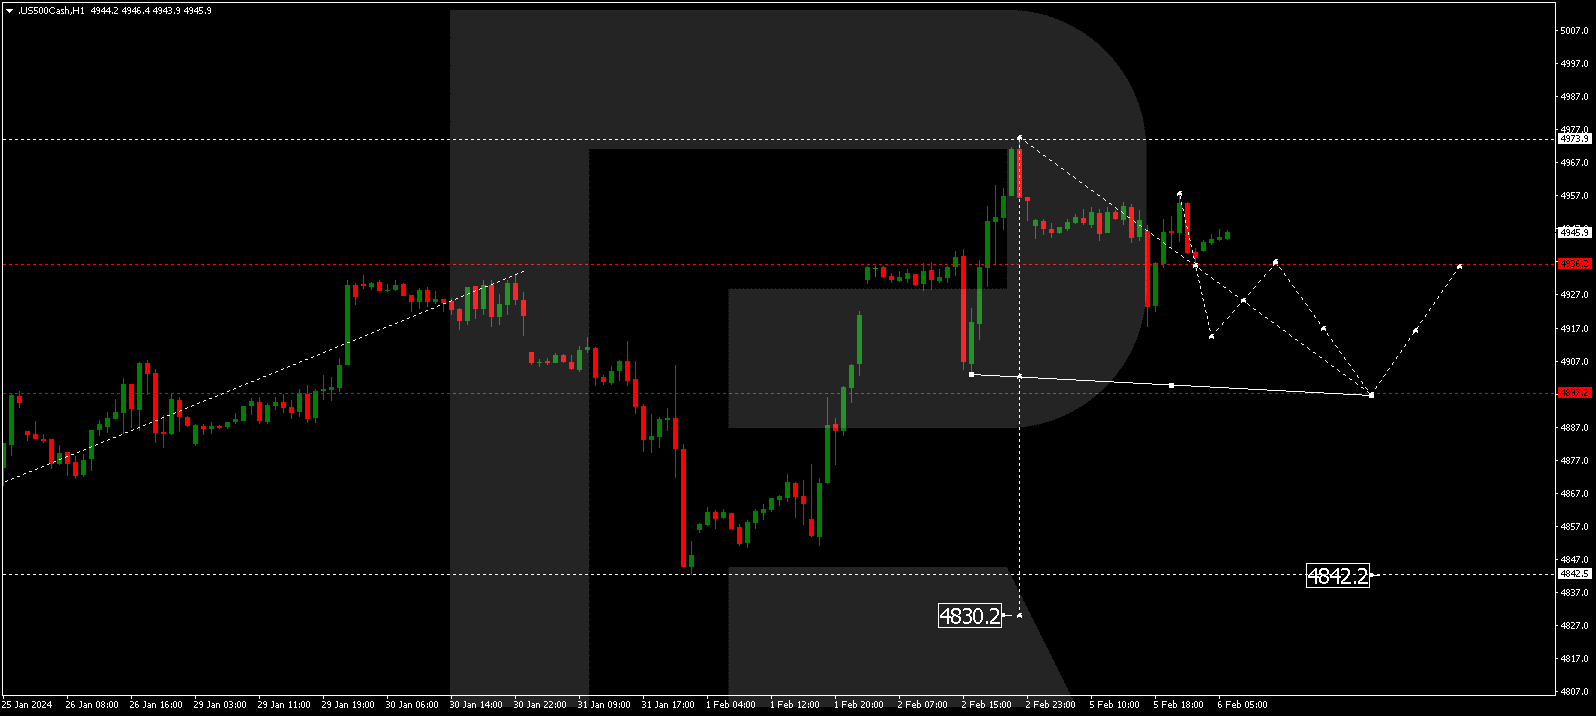
The stock index is in the process of forming a consolidation range around 4936.2. An escape downward may trigger a wave to 4897.0, marking the initial target. Following this, quotes could correct to 4936.0 (a test from below), and subsequently, a decline to 4842.2 appears plausible. This marks a local target.
The post Technical Analysis & Forecast February 06, 2024 appeared first at R Blog – RoboForex.