
EUR May Continue Correcting Before a New Decline. The overview also encompasses the dynamics of GBP, JPY, CHF, AUD, Brent, Gold, and the S&P 500 index.
EUR/USD (Euro vs US Dollar)
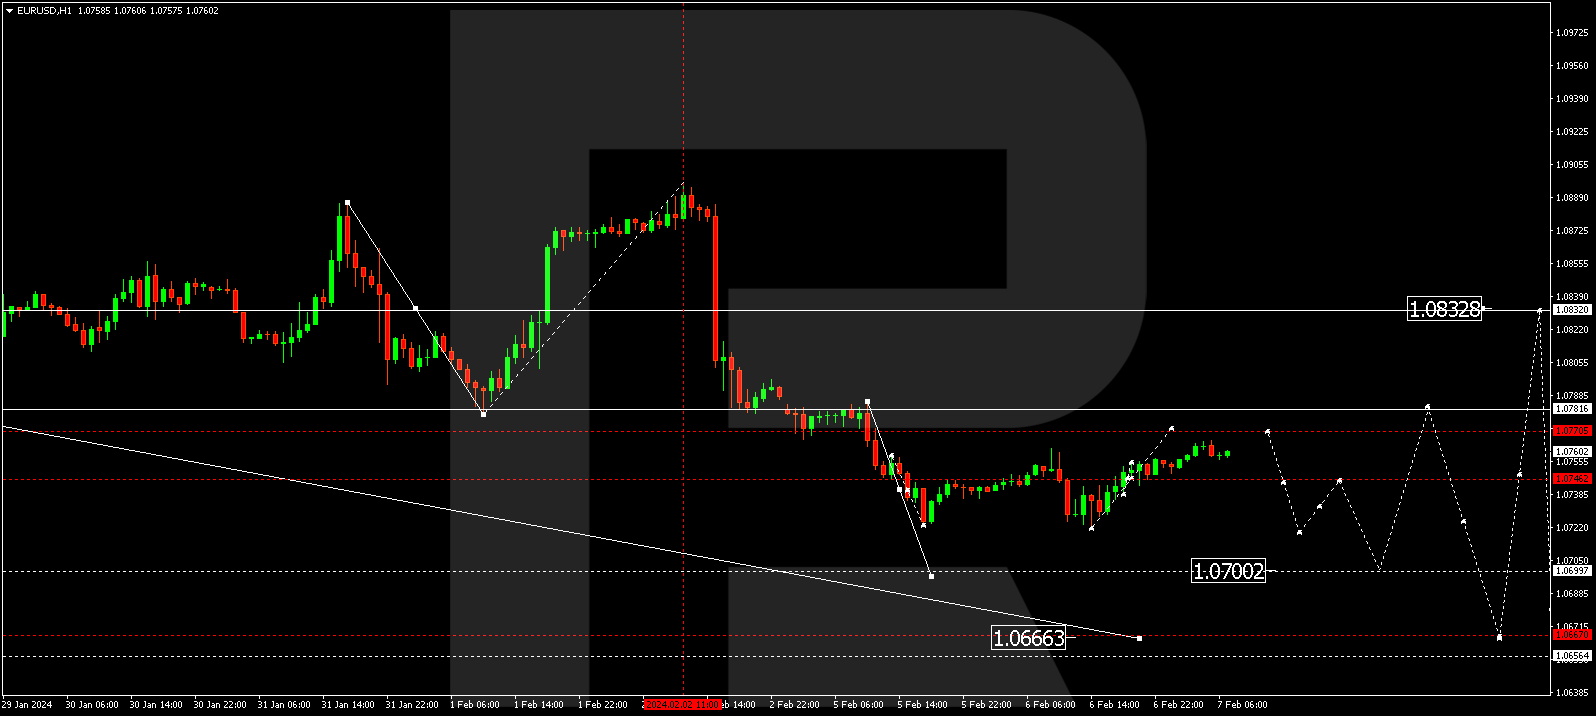
The EUR/USD pair has concluded a correction wave at the 1.0745 level. Currently, a consolidation range has emerged around this level. The market has broken out of this range today, indicating a potential further correction to 1.0770. Following this, the decline wave could extend to 1.0700, from where the trend might proceed to 1.0666.
GBP/USD (Great Britain Pound vs US Dollar)
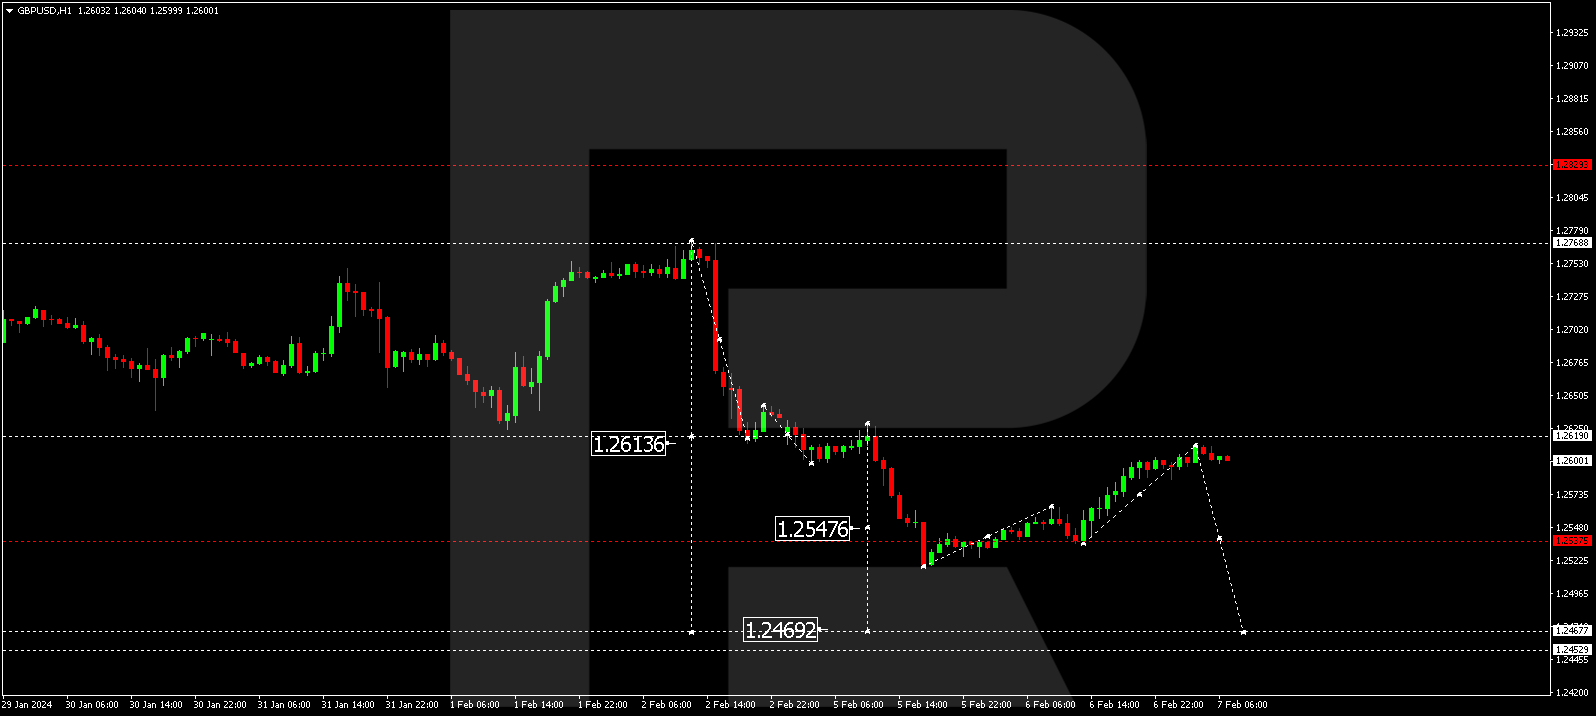
The GBP/USD pair continues the correction wave to the 1.2620 level (a test from below). After the correction concludes, a new decline wave to 1.2470 may commence. This is the initial target.
USD/JPY (US Dollar vs Japanese Yen)
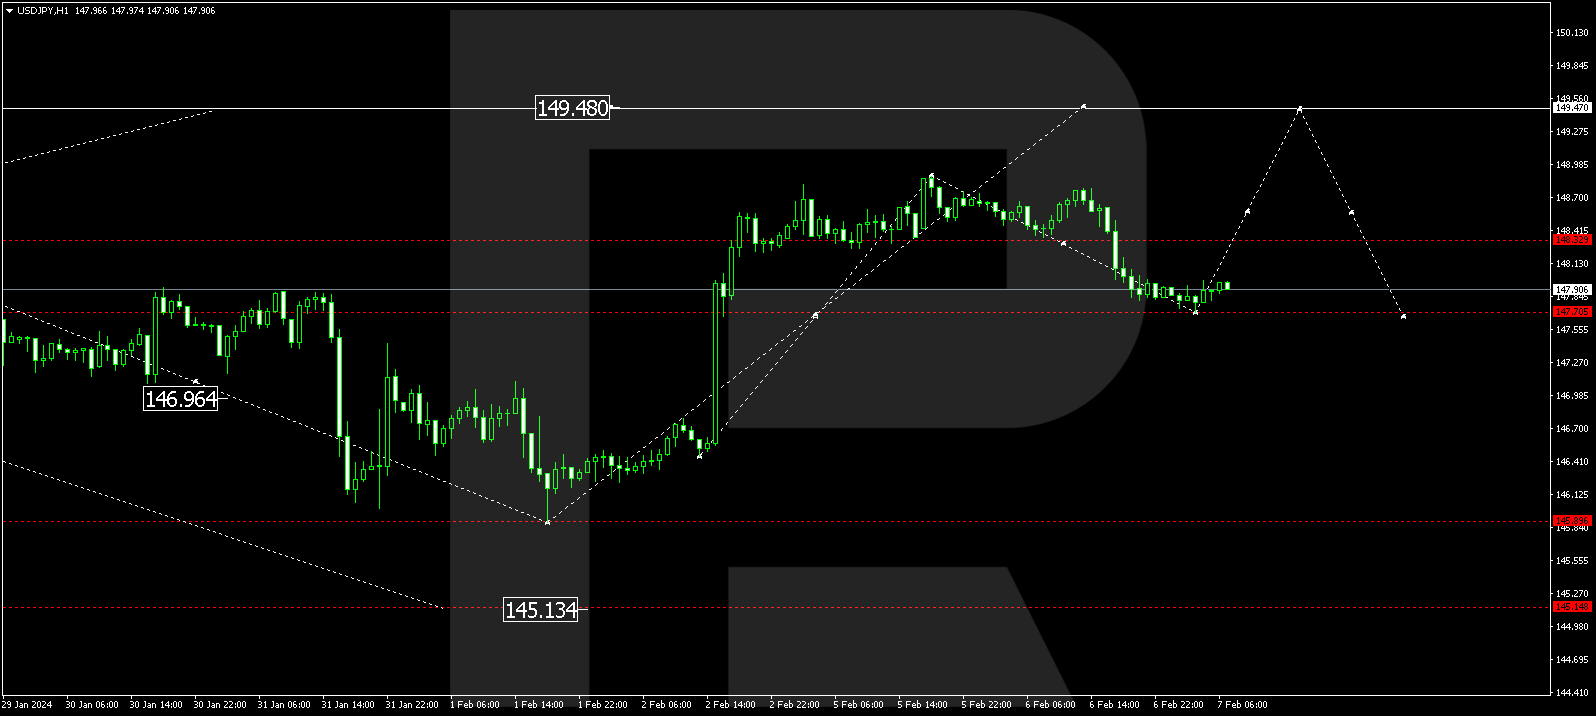
The USD/JPY pair has completed a correction wave to 147.77. Currently, the market is forming a consolidation range above this level. An upward breakout from the range could lead to a rise to 149.47. Once this level is reached, a decline wave to 148.00 might initiate. This is the primary target.


USD/CHF (US Dollar vs Swiss Franc)
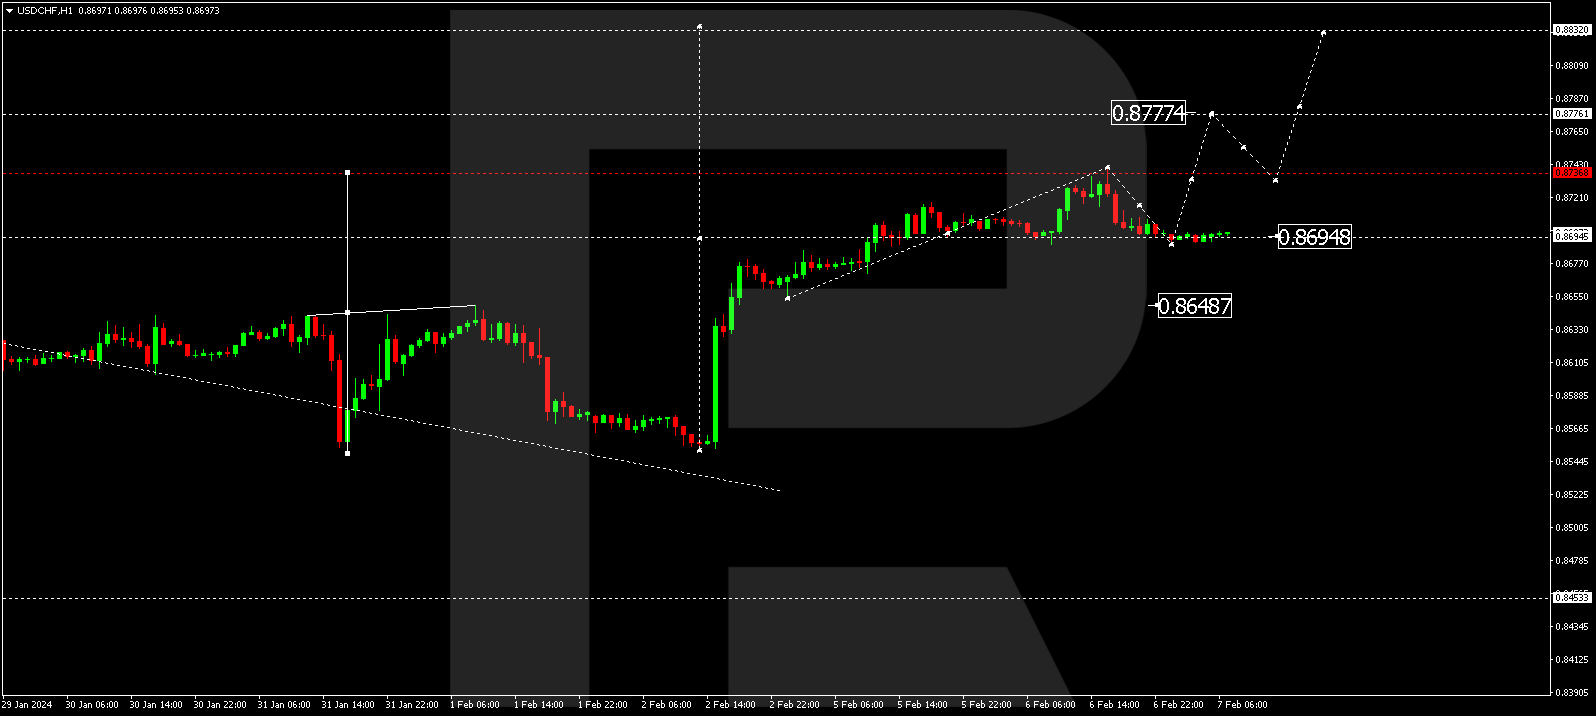
The USD/CHF pair has concluded a correction wave at 0.8695. Presently, the market is forming a consolidation range above this level. There is a possibility of an upward breakout from the range, extending the growth wave to 0.8777. This serves as a local target.
AUD/USD (Australian Dollar vs US Dollar)
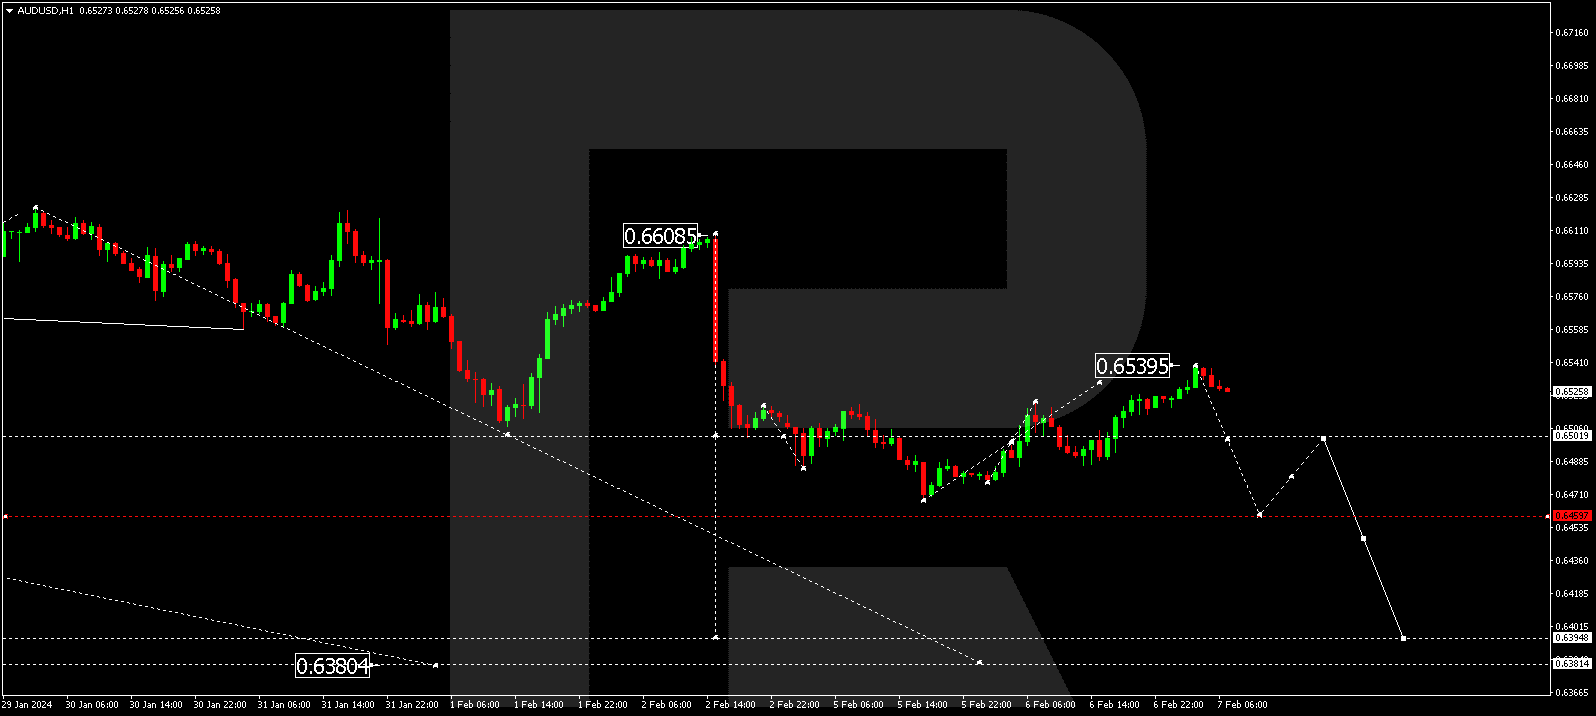
The AUD/USD pair has finalized a corrective wave at 0.6539. Today, the correction is anticipated to conclude, initiating a decline wave to 0.6500. If this level is breached, the potential for a decline wave to 0.6455 might emerge. This represents a local target.
BRENT
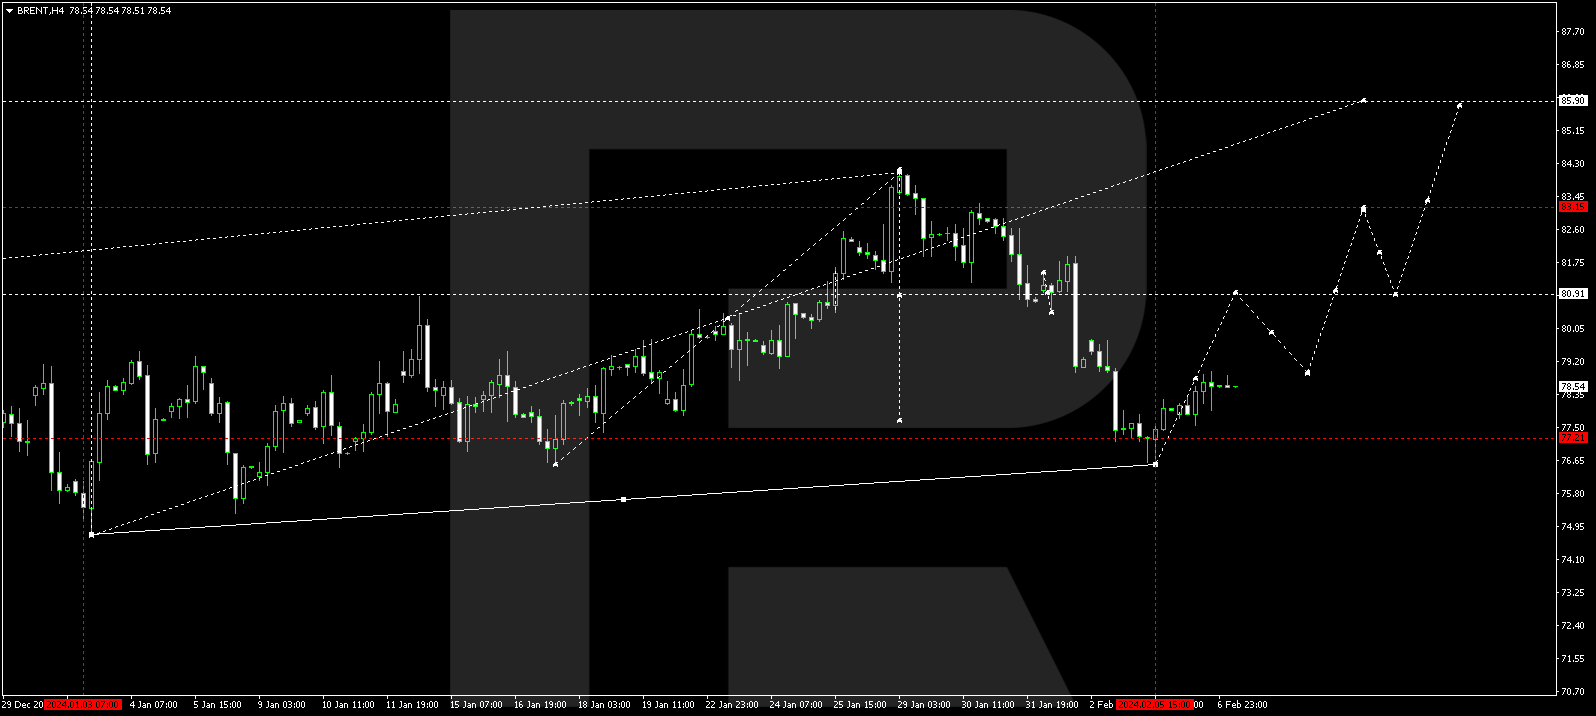
Brent continues to develop a growth wave to 79.85. Following the attainment of this level, a correction link to 78.20 cannot be ruled out. Subsequently, after the correction concludes, a new growth wave to 80.90 might initiate. If this level is surpassed, the potential for a rise to 83.15 may emerge. This serves as a local target.
XAU/USD (Gold vs US Dollar)
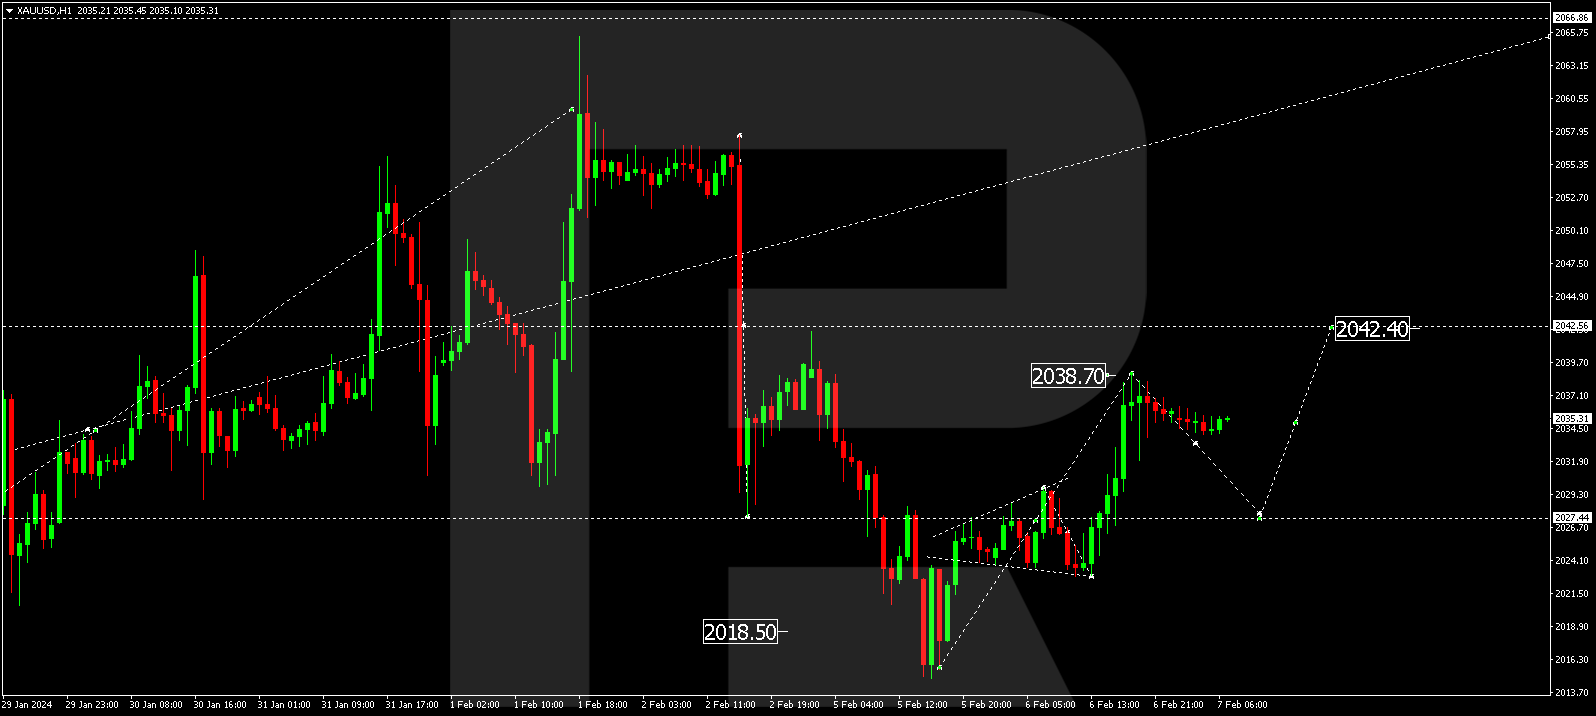
Gold has completed a correction wave to 2038.70. A decline to 2027.27 might unfold. Subsequently, another correction link to 2042.42 could develop. Once this level is reached, a new decline wave to 2020.20 might commence.
S&P 500
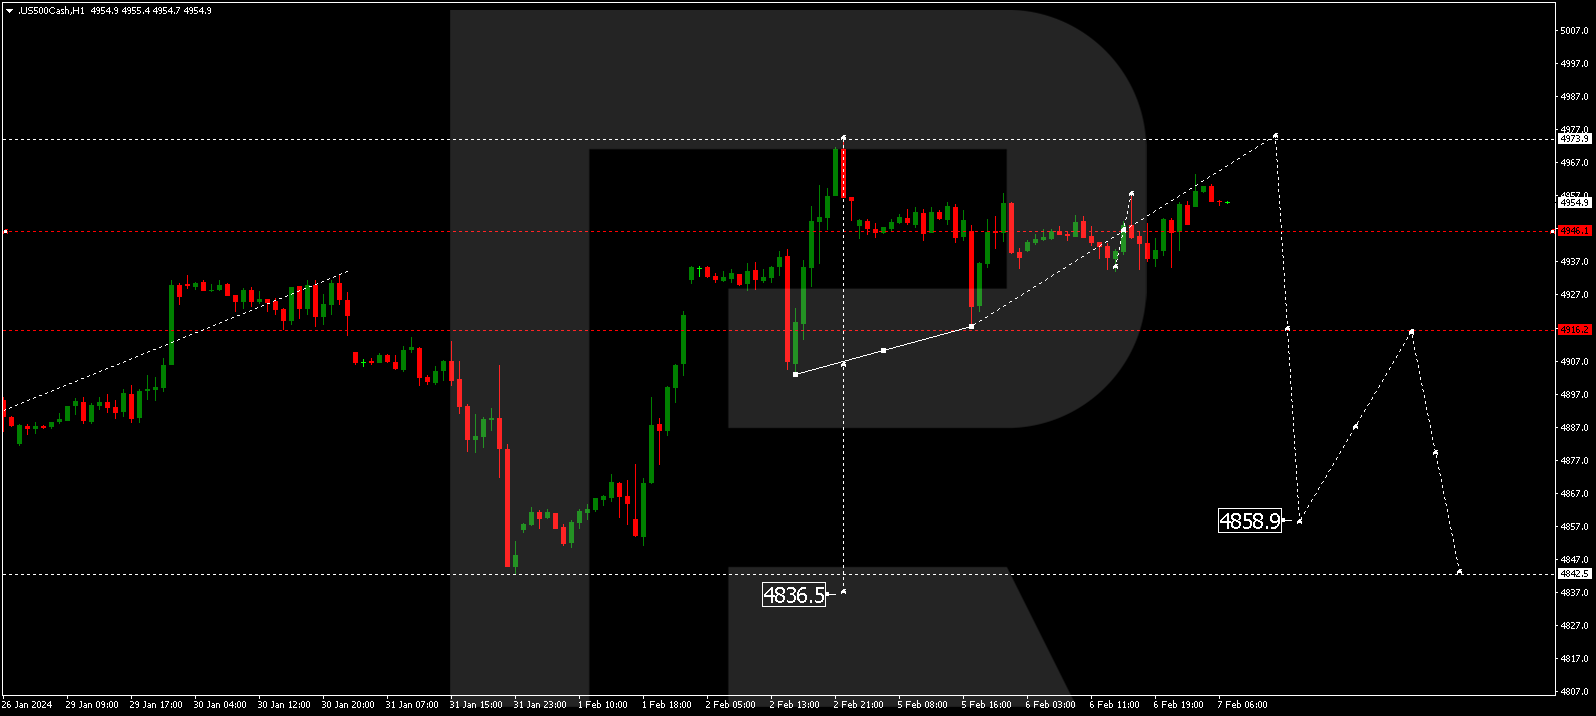
The stock index continues to form a consolidation range around 4946.0. An upward breakout from the range could lead to a growth link to 4974.0. Alternatively, with a downward breakout, the wave might develop to 4920.0. This represents the initial target. Once this level is reached, the price might correct to 4946.0 (a test from below). A decline to 4860.0 might ensue. This is a local target.
The post Technical Analysis & Forecast February 07, 2024 appeared first at R Blog – RoboForex.