
The S&P 500 index is in the midst of a descending phase. This analysis also encompasses the movements of EUR, GBP, JPY, CHF, AUD, Brent, and Gold.
EUR/USD (Euro vs US Dollar)
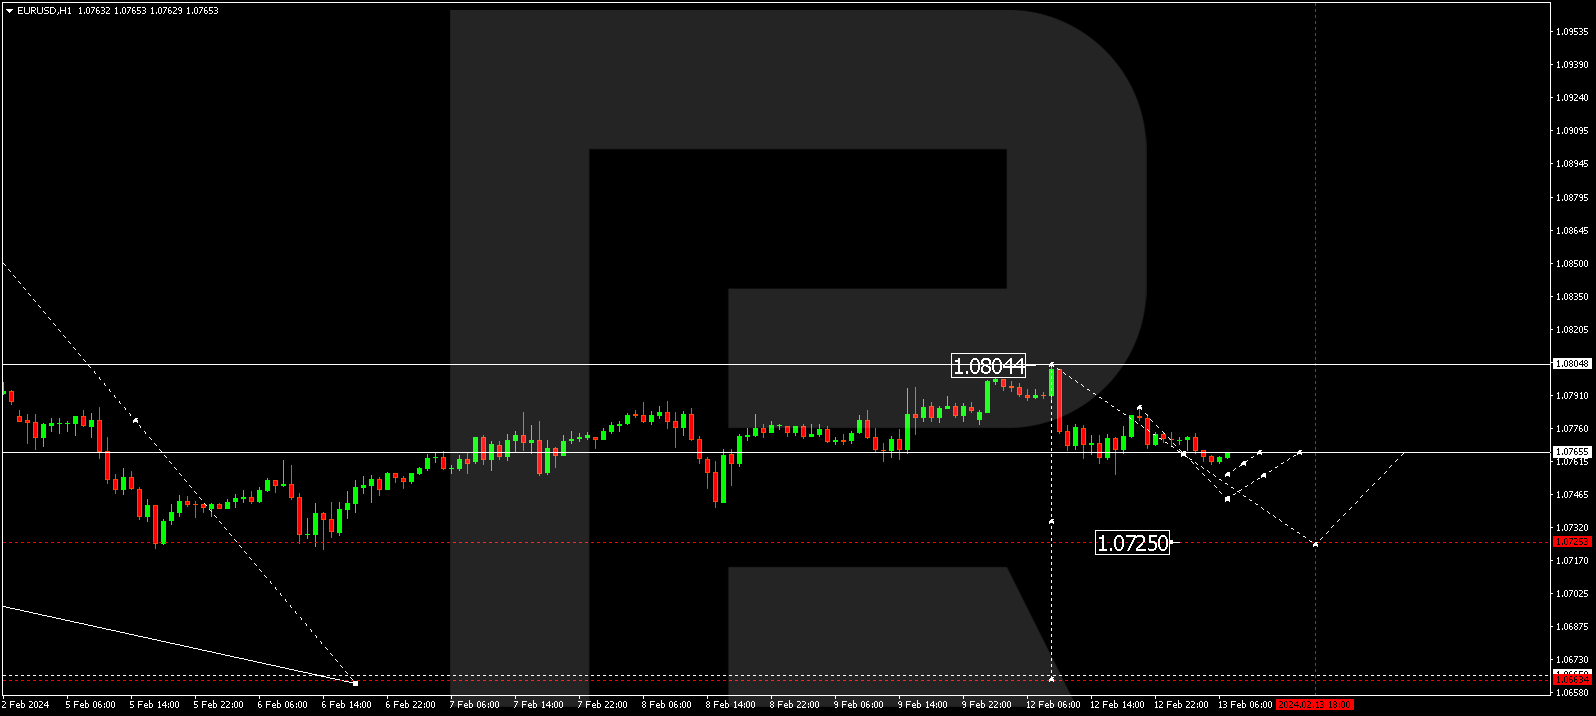
The EUR/USD pair has undergone a downtrend to 1.0755. Currently, the market is establishing a narrow consolidation range around 1.0765. An anticipated downward breakout from the range to 1.0744 might occur today. Should this level be breached, the potential for a descent to 1.0725 could emerge, extending the trend to 1.0666 – the initial target.
GBP/USD (Great Britain Pound vs US Dollar)
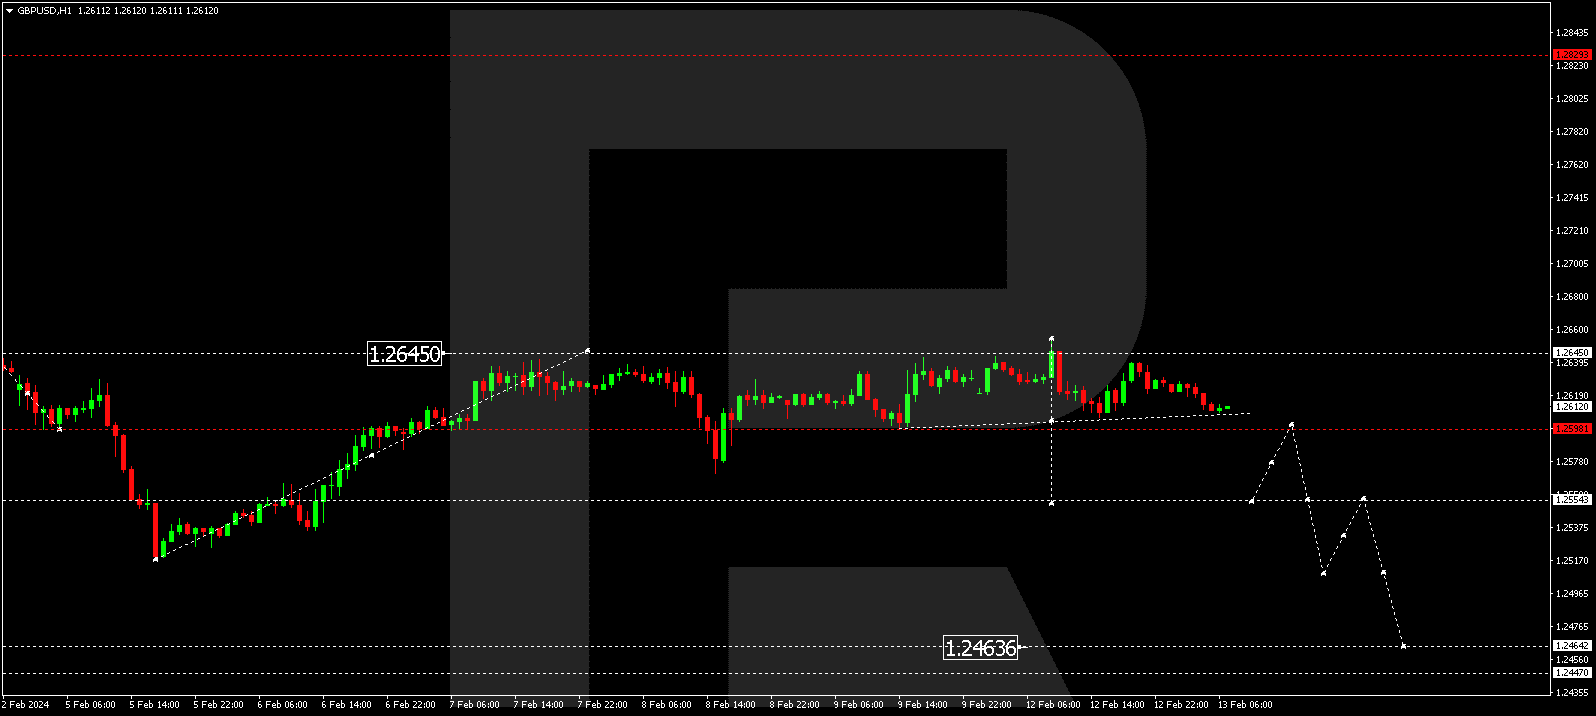
The GBP/USD pair is in the process of developing a consolidation range approximately at 1.2598. An escape downward from the range could lead to the formation of a descending wave structure towards 1.2555. A further break below this level might open the potential for a decline wave to 1.2464. This serves as a local target.
USD/JPY (US Dollar vs Japanese Yen)
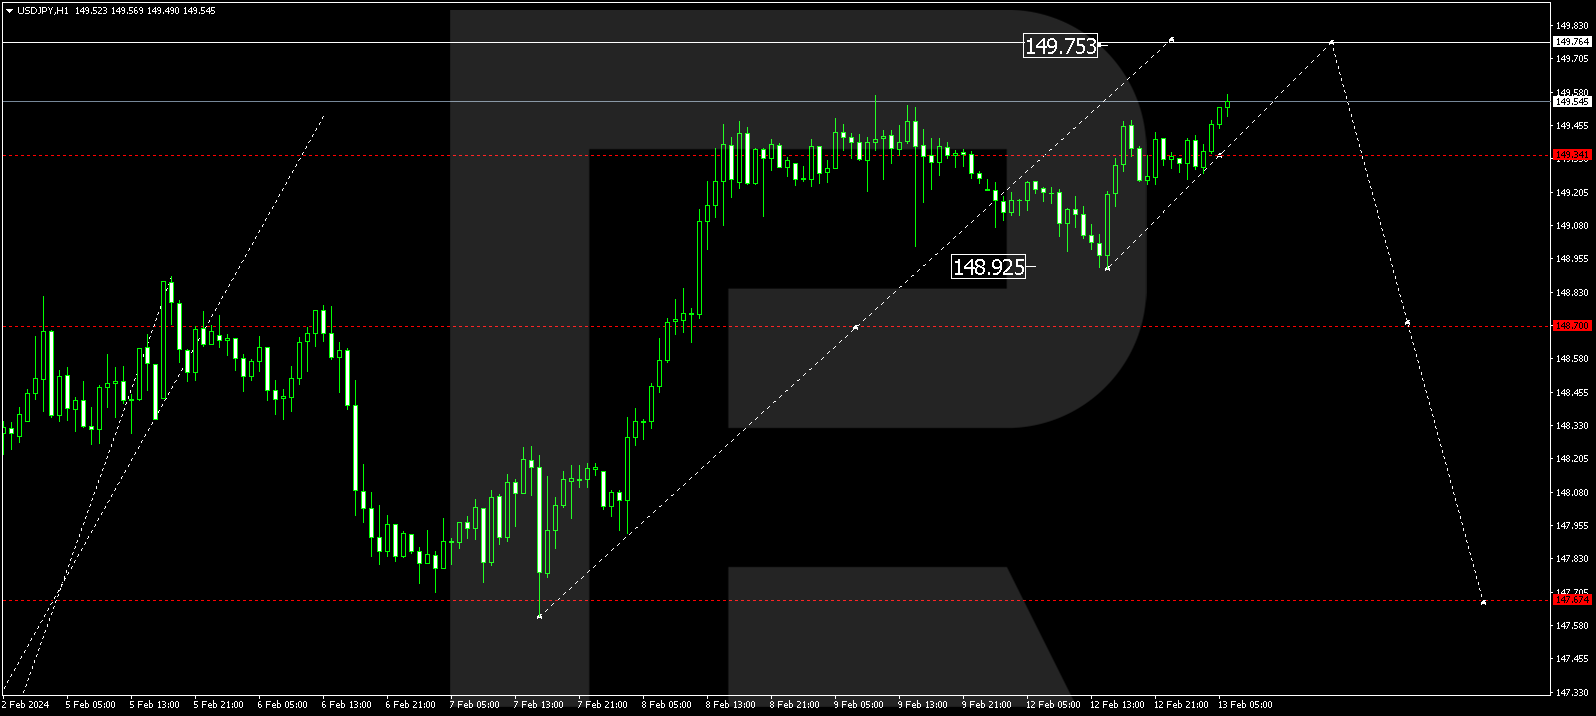
The USD/JPY pair is currently shaping a consolidation range around 149.34. A potential upward breakout from the range to 149.76 is not ruled out today. Subsequently, a decline wave to 148.70 might commence, marking the beginning of a trend extending to 147.67.


USD/CHF (US Dollar vs Swiss Franc)
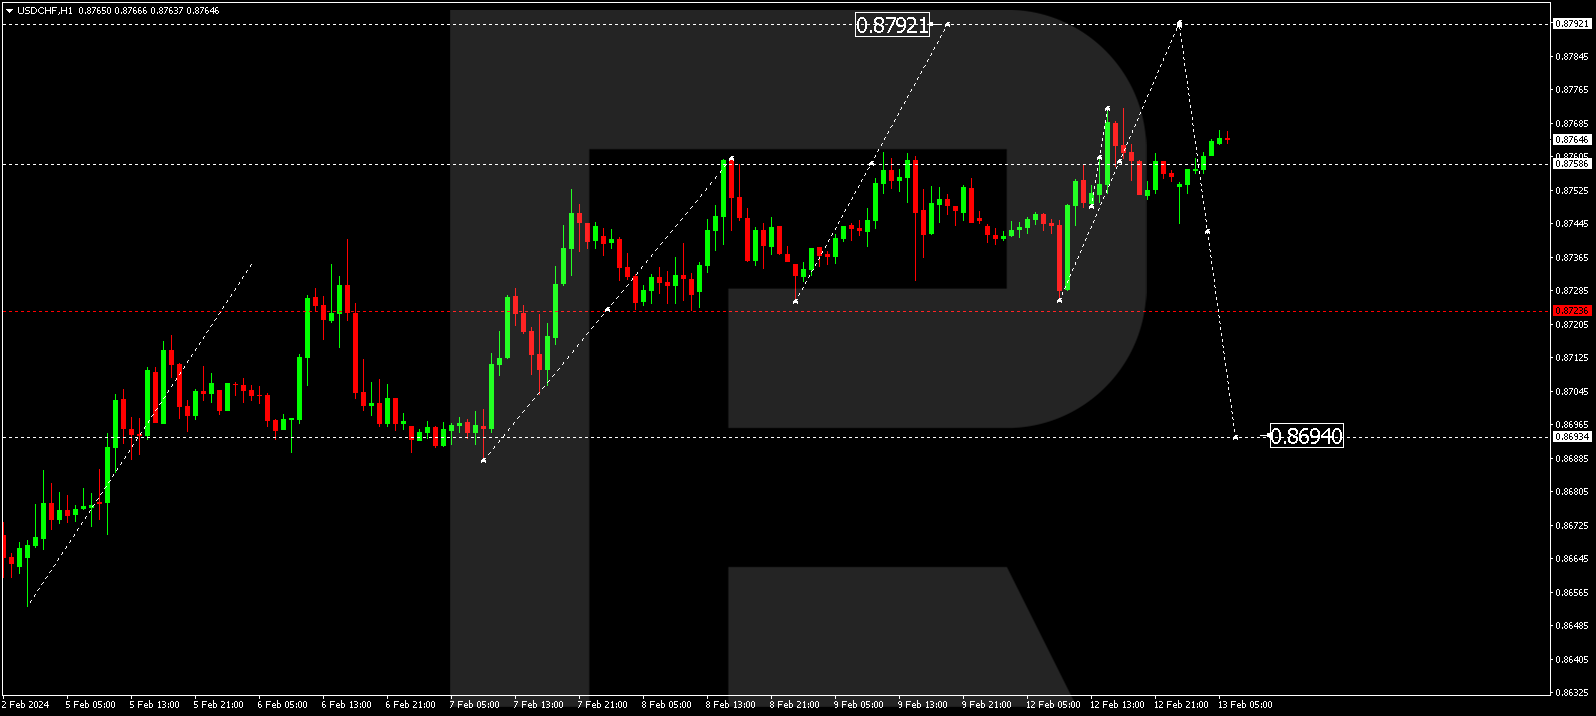
The USD/CHF pair is in the process of forming a consolidation range near 0.8755. An upward breakout from the range to 0.8792 could materialize today, followed by an expected correction wave to 0.8694.
AUD/USD (Australian Dollar vs US Dollar)
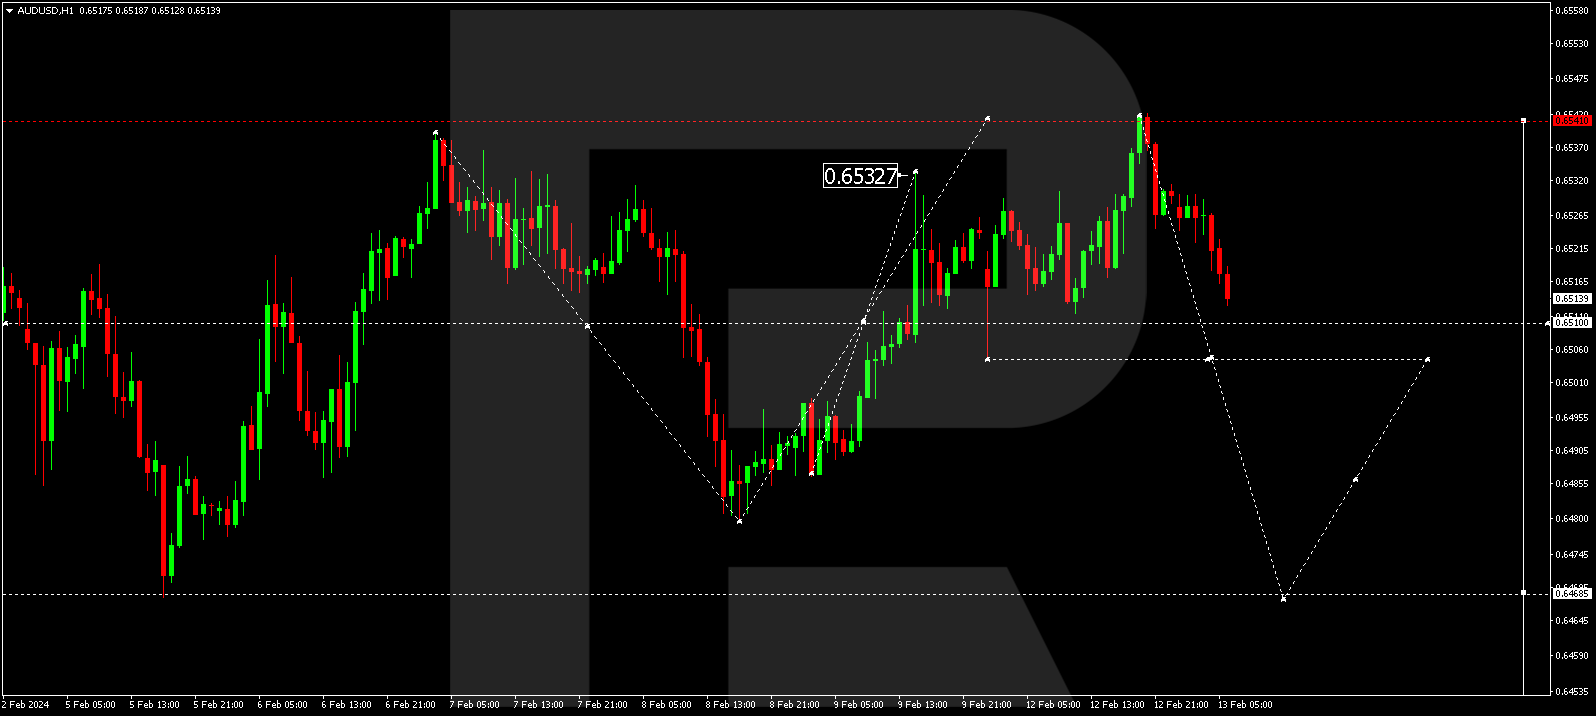
The AUD/USD pair continues to mold a consolidation range around 0.6520. An anticipated downward breakout from the range to 0.6500 might occur today. Subsequently, a correction to 0.6520 might ensue, followed by a decline to 0.6450. This represents the initial target in the declining structure governed by the downtrend.
BRENT
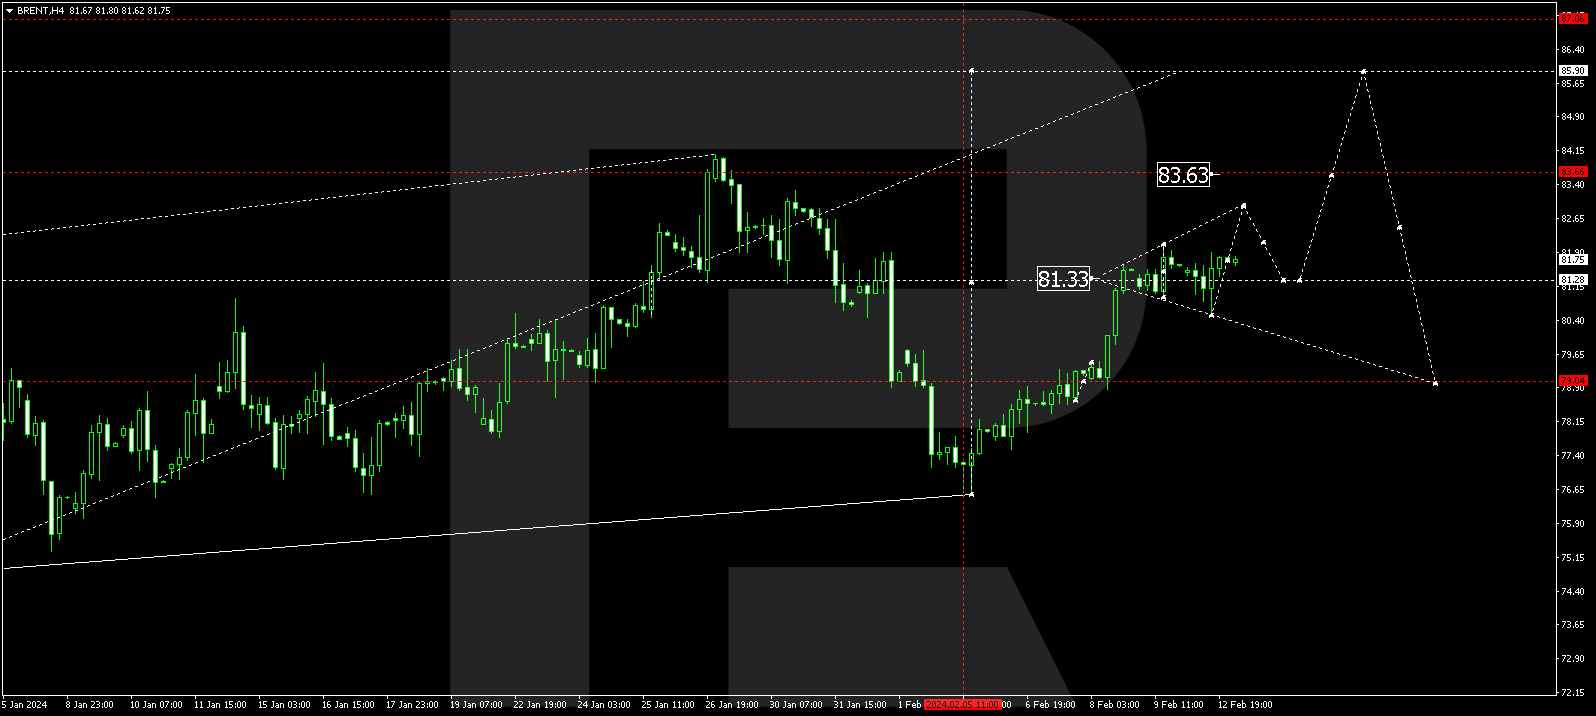
Brent is currently constructing a consolidation range beneath 82.33. A potential downward breakout from the range to 79.10 cannot be discounted. Conversely, an upward breakout might pave the way for a growth wave to 83.63 – a local target. Following this achievement, a correction to 81.30 may ensue, succeeded by a rise to 85.90, marking the initial target.
XAU/USD (Gold vs US Dollar)
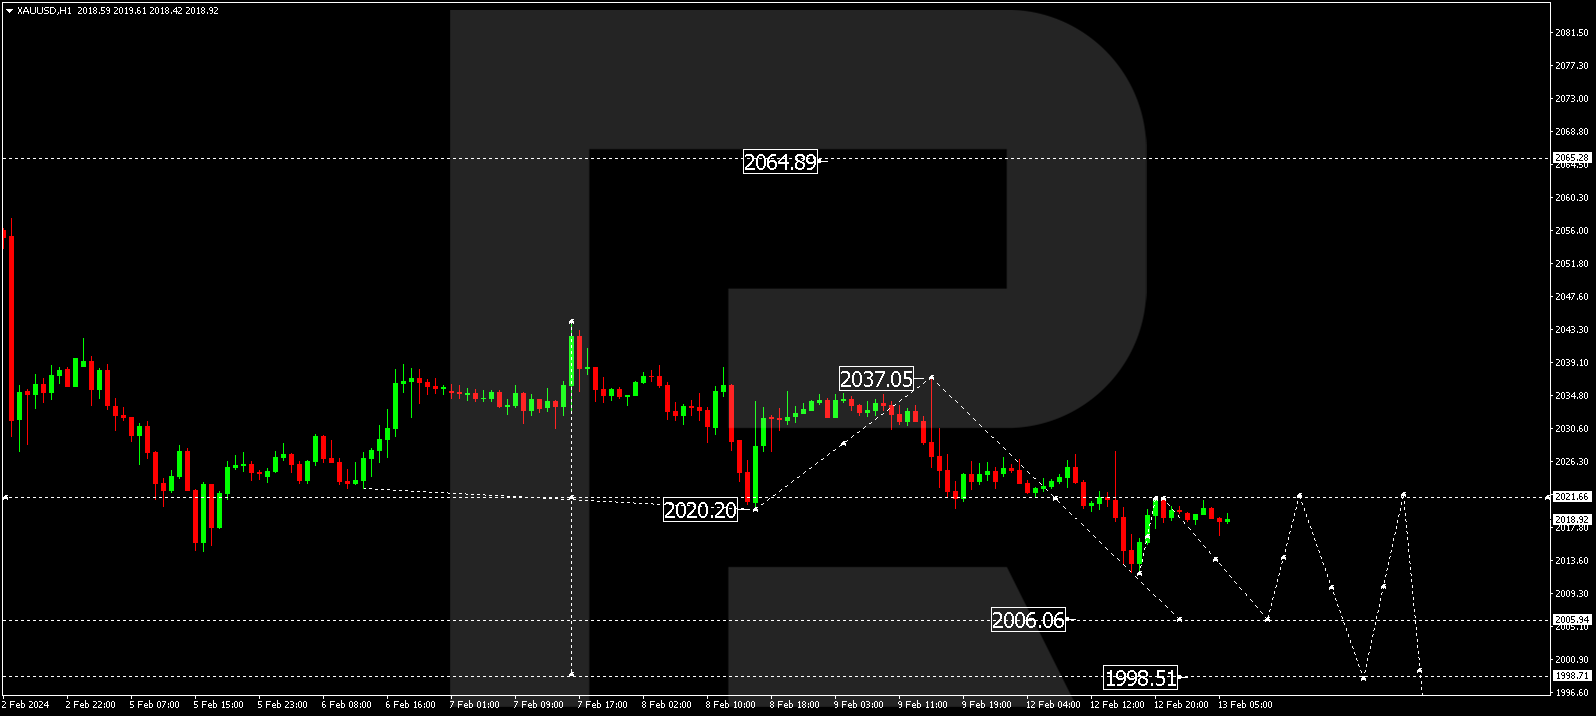
Gold has successfully completed a decline wave to 2011.90. Currently, the market has technically returned to 2021.66 (a test from below). The wave might extend to 2006.06, constituting a local target. Upon reaching this level, a correction link is plausible, after which a decline wave to 1998.50 is expected.
S&P 500
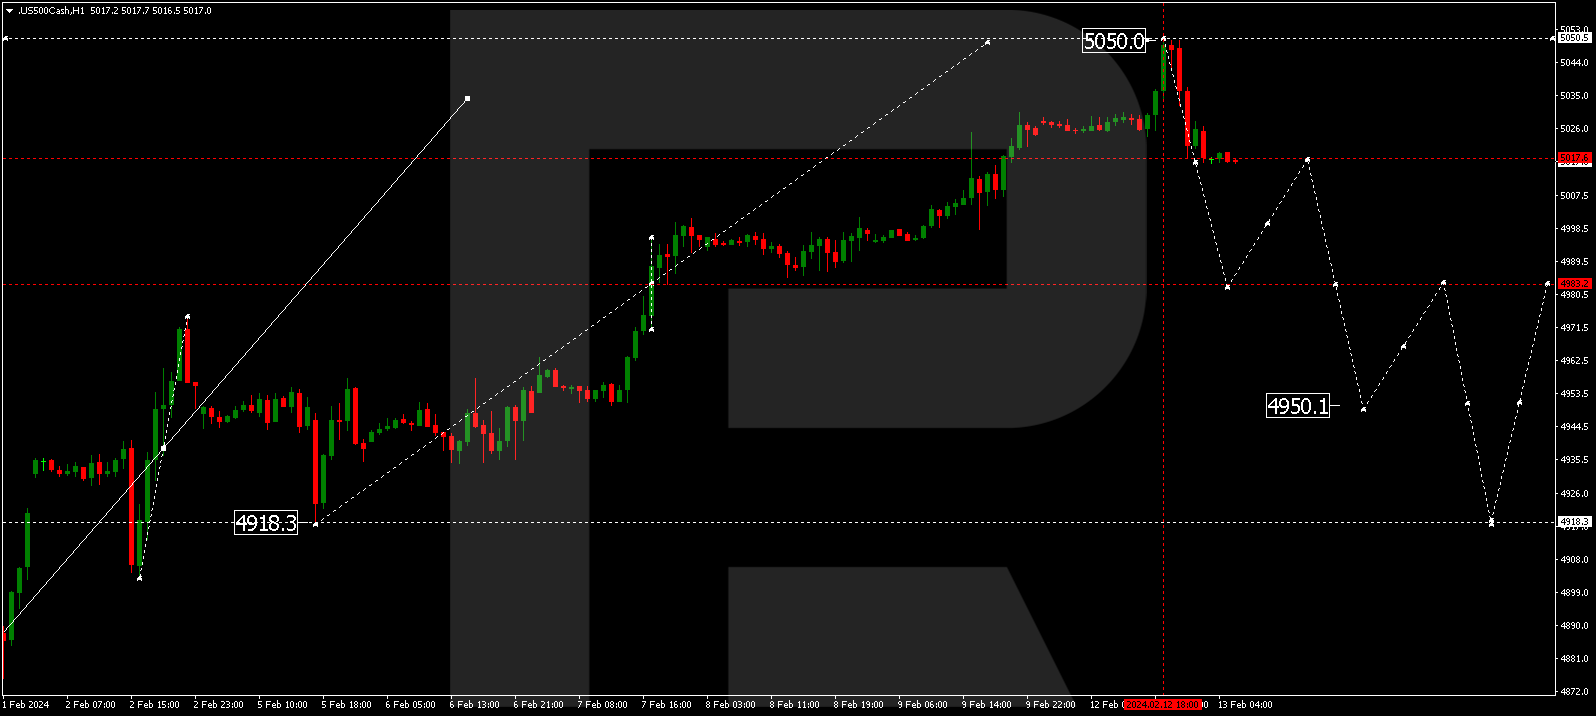
The stock index has concluded a growth wave at 5050.0. A descending impulse to 5017.0 has manifested today. At present, a consolidation range is materializing around this level. The impulse is predicted to persist, targeting 4993.0 as the initial goal. Subsequently, a correction link to 5017.0 is anticipated (a test from below). Following this, a decline wave to 4950.0 might commence, marking the initiation of a trend extending to 4918.0.
The post Technical Analysis & Forecast February 13, 2024 appeared first at R Blog – RoboForex.