
Gold‘s upward momentum may persist. The analysis also encompasses the movements of EUR, GBP, JPY, CHF, AUD, Brent, and the S&P 500 index.
EUR/USD (Euro vs US Dollar)
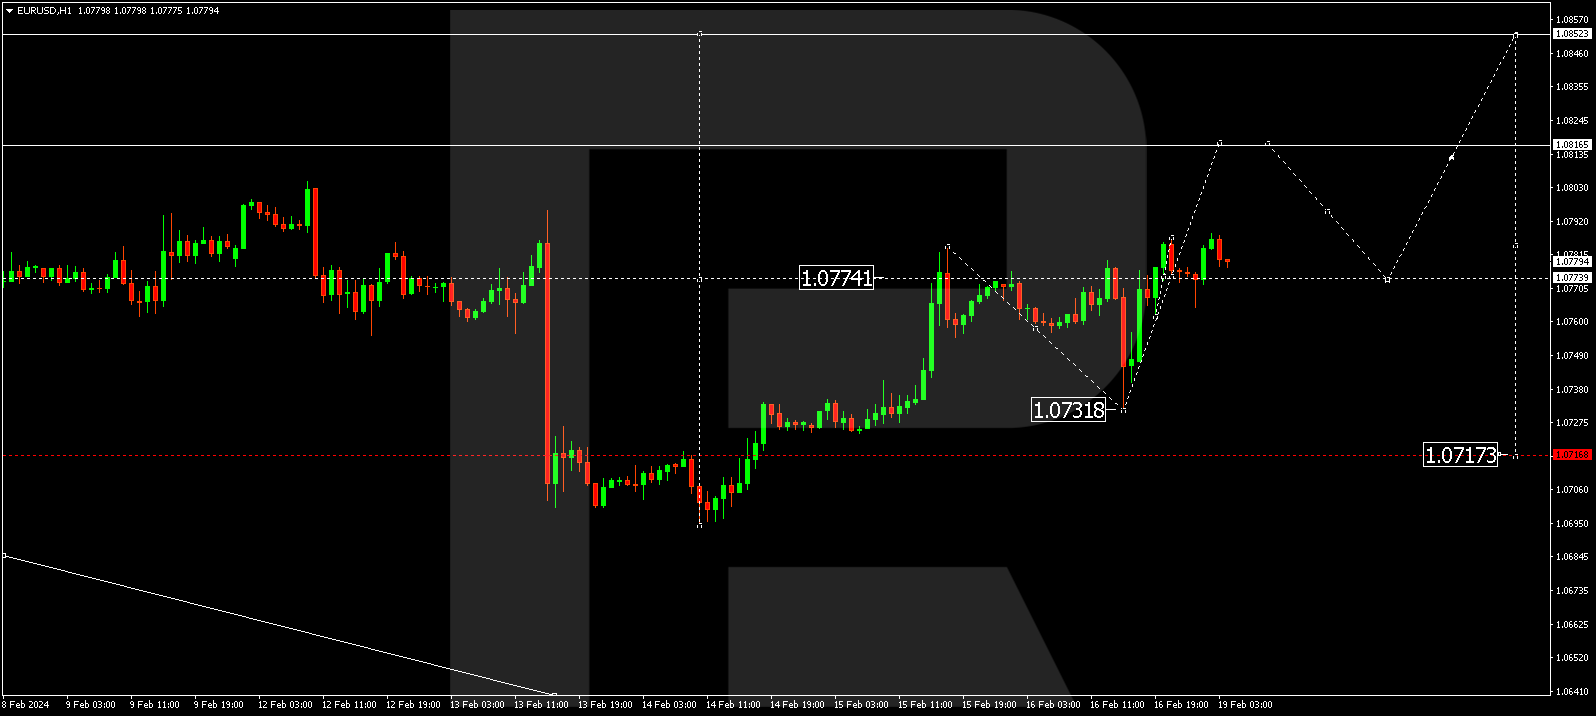
The EUR/USD pair found support at the 1.0732 level and has subsequently surged to 1.0787. Currently, a consolidation range is taking shape below this level. If there’s an upward breakout, the correction may extend to 1.0816. Once reached, a decline to 1.0774 could follow (a test from above). Subsequently, a new upward structure to 1.0852 might take form. In case of a downward breakout from the range, the decline could continue in line with the trend to 1.0717.
GBP/USD (Great Britain Pound vs US Dollar)
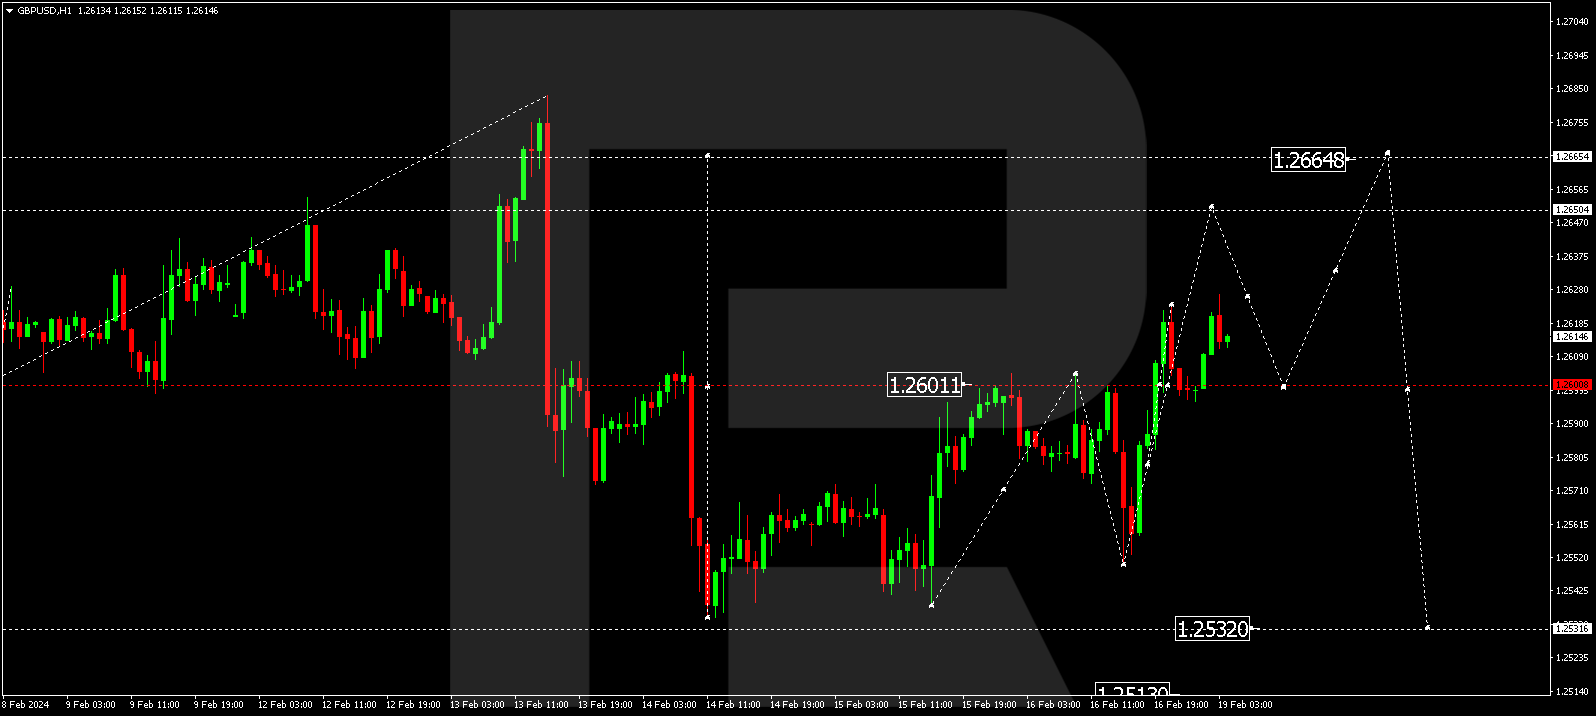
Having found support at 1.2550, the GBP/USD pair has risen to 1.2623. Today, a consolidation range is forming below this level. An upward breakout might extend the correction to 1.2650. Following this, a decline to 1.2608 might occur (a test from above). If there’s a downward breakout from the range, the potential for a decline to 1.2531 might open.
USD/JPY (US Dollar vs Japanese Yen)
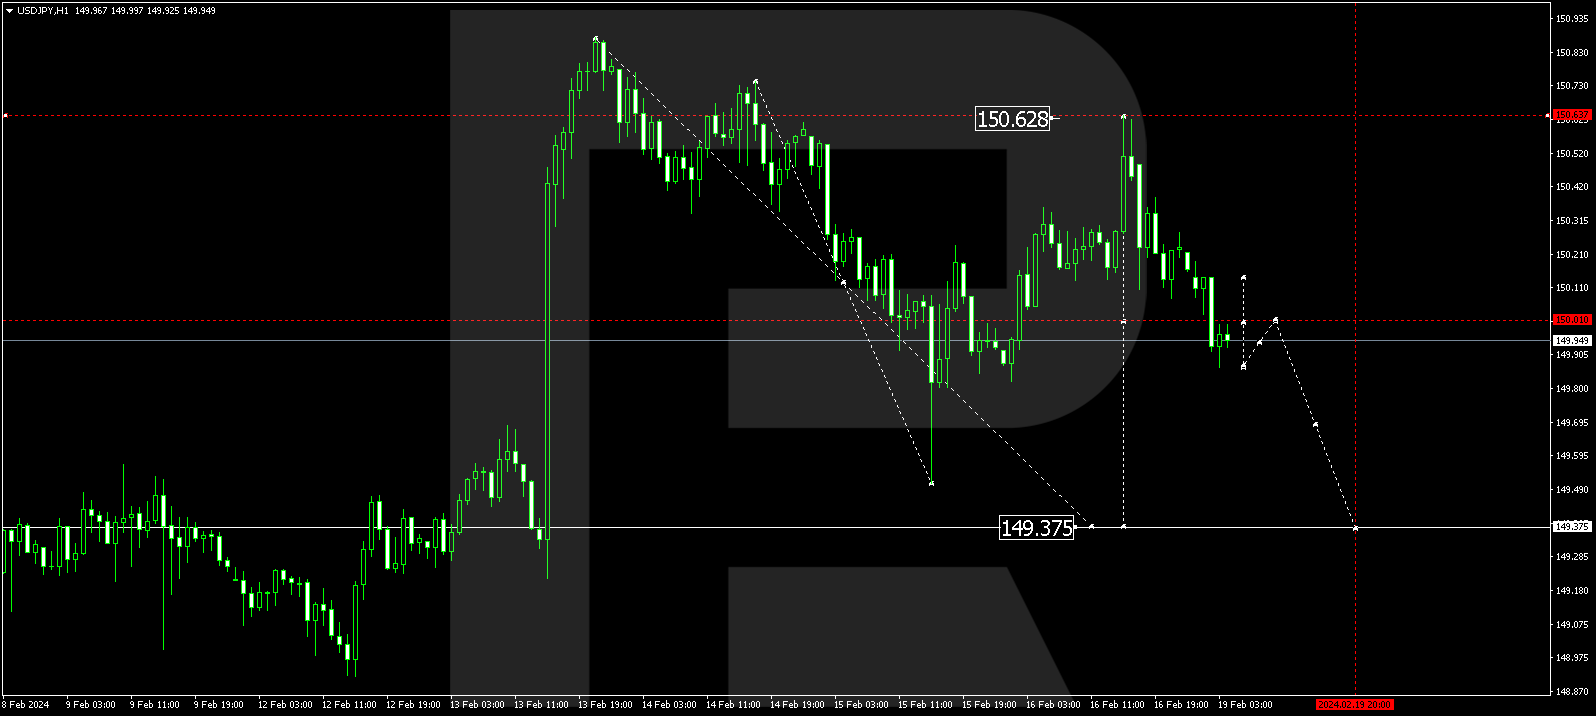
After a growth wave to 150.63, the USD/JPY pair has demonstrated a decline to 150.01. Currently, a consolidation range is forming around this level. A downward breakout from the range could lead to a decline wave to 149.37, while an upward breakout may continue the growth wave to 150.80.


USD/CHF (US Dollar vs Swiss Franc)
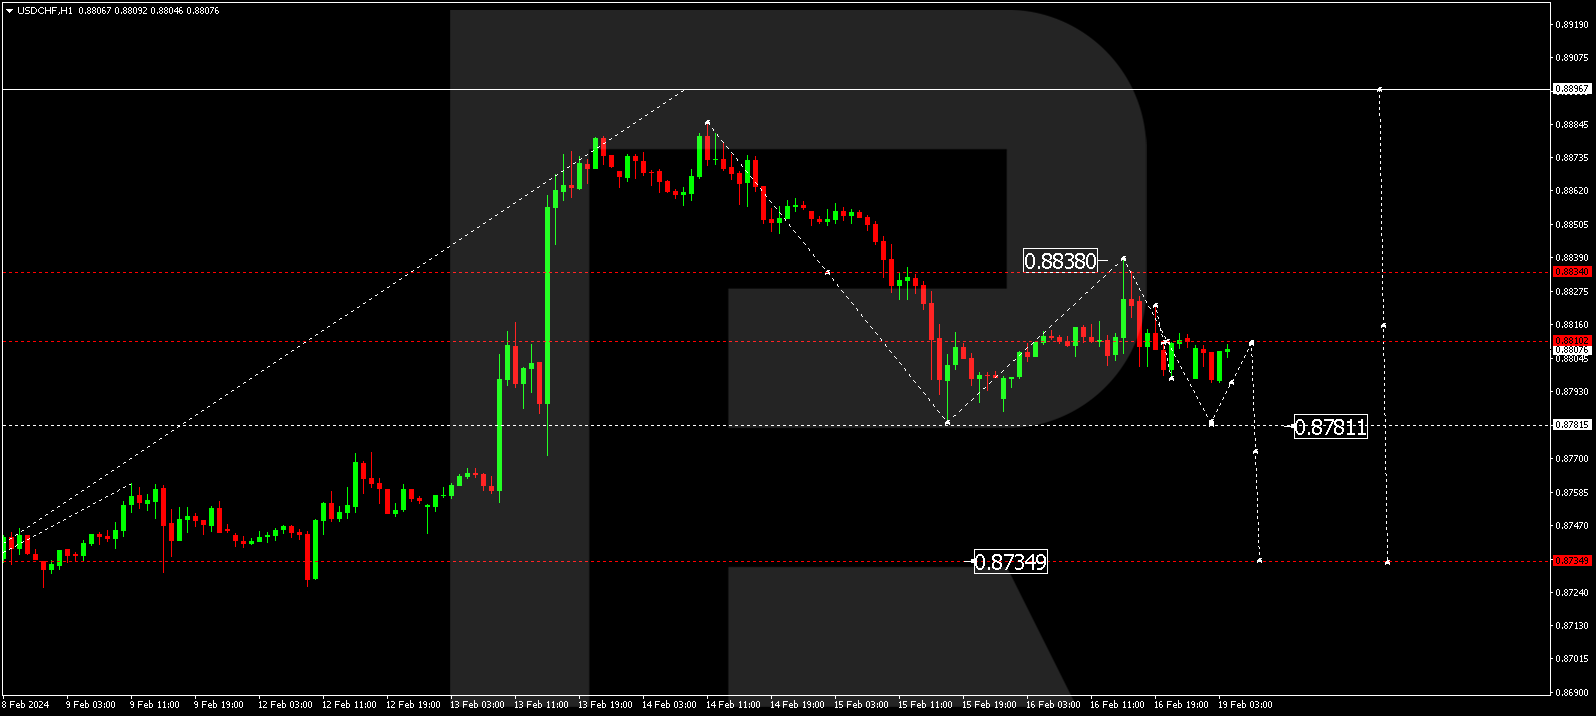
The USD/CHF pair is consolidating around the 0.8810 level without a clear trend. A downward breakout may continue the correction to 0.8781, followed by a decline to 0.8735. Conversely, an upward breakout may lead to a growth wave to 0.8897.
AUD/USD (Australian Dollar vs US Dollar)
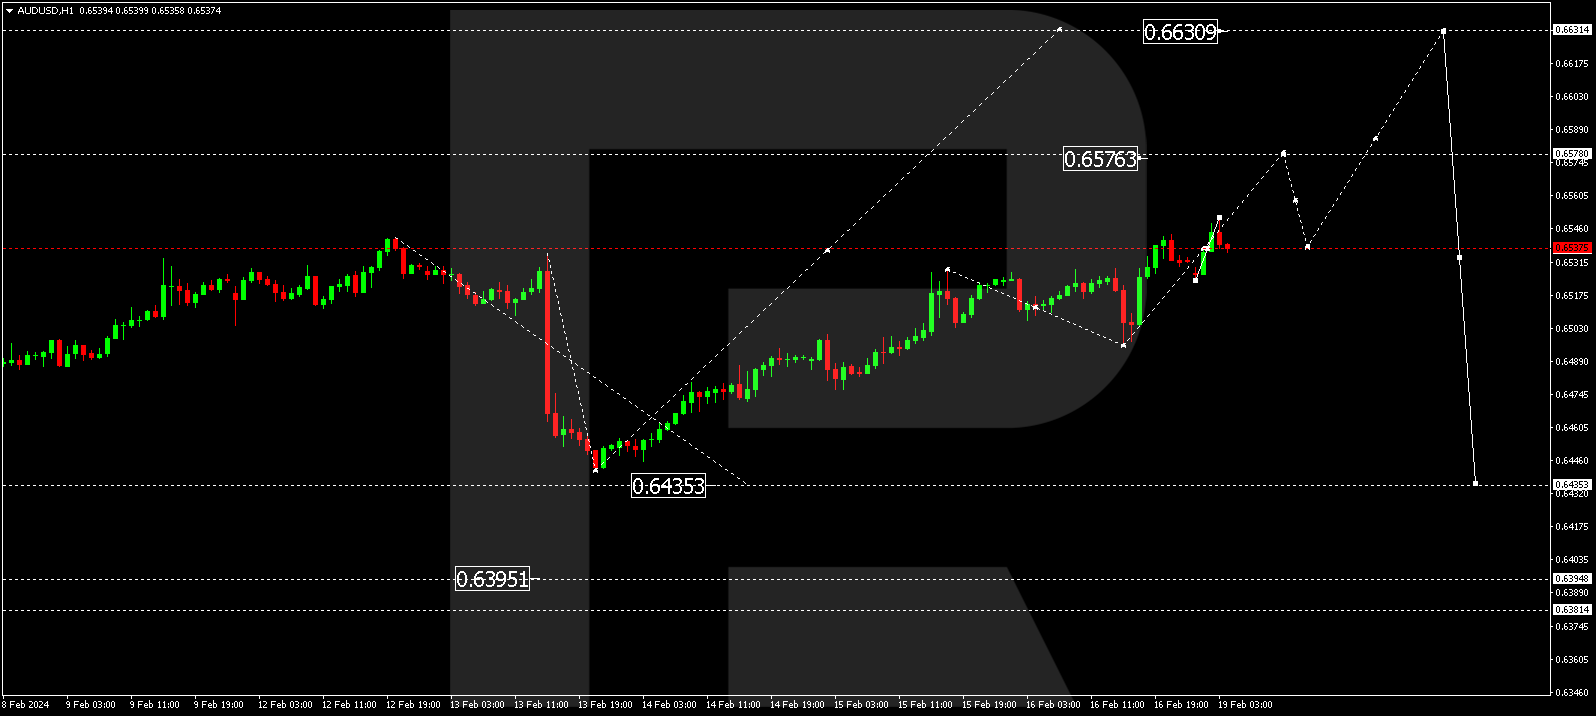
Finding support at 0.6496, the AUD/USD pair has risen to 0.6551. Today, a consolidation range is forming below this level. An upward breakout may extend the correction to 0.6578. Conversely, a downward breakout could open the potential for a trend-driven decline to 0.6435.
BRENT
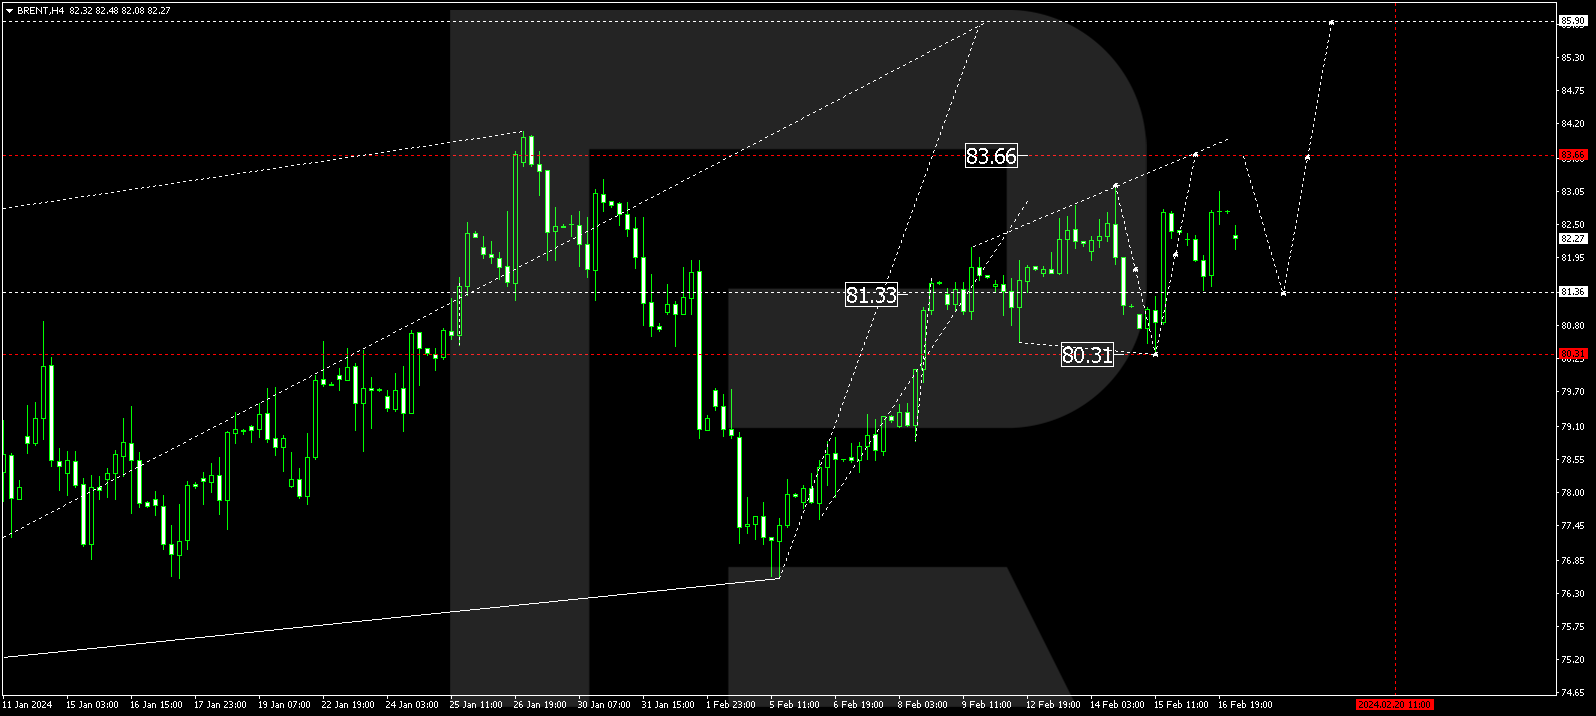
Brent has completed a growth wave to 83.05. A correction to 81.35 is plausible today. Once the correction concludes, a rise to 83.66 might follow, extending the trend to 85.90. This marks a local target.
XAU/USD (Gold vs US Dollar)
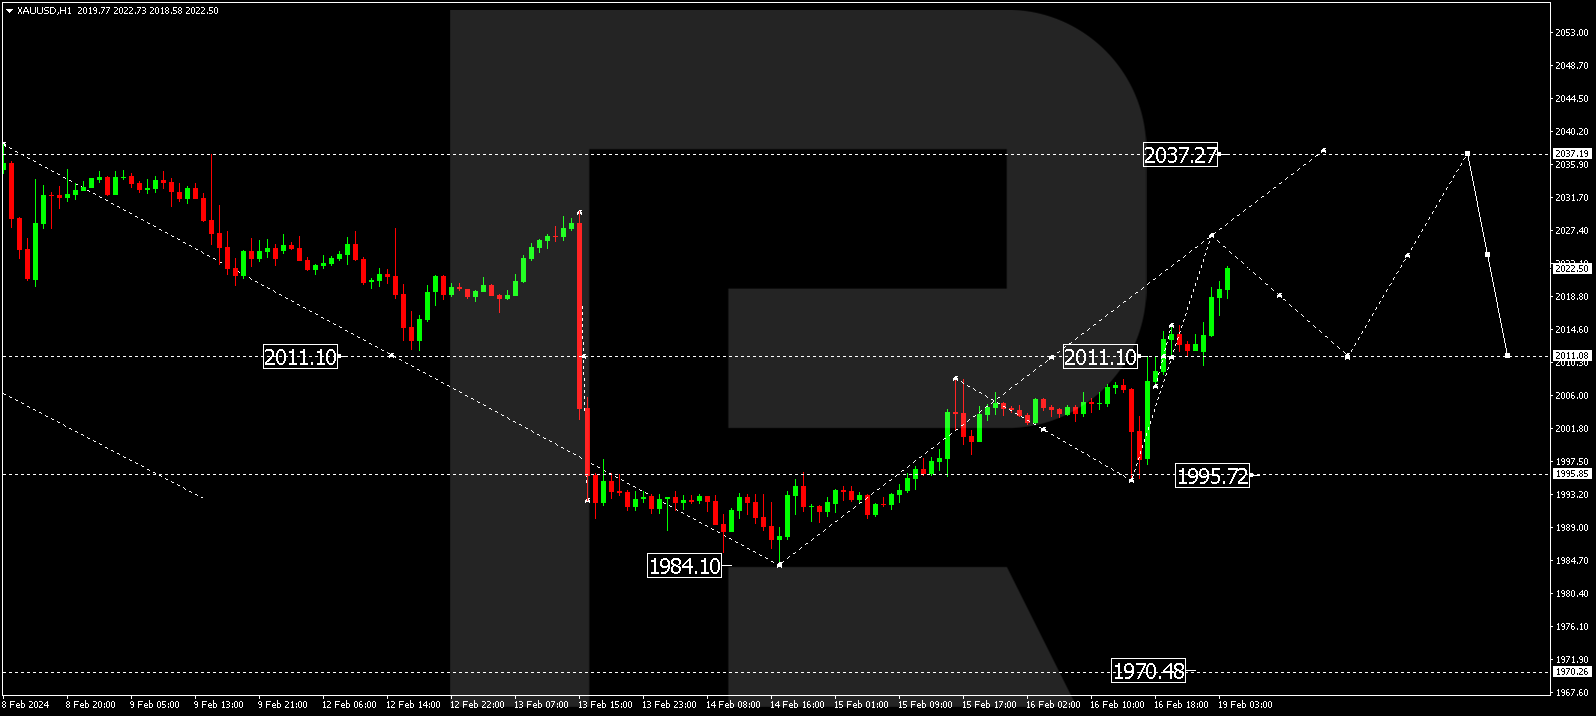
Gold found support at the 1995.72 level and completed a growth wave to 2011.08. Today, a consolidation range is forming around this level. An upward breakout may extend the correction wave to 2026.55. Once this level is reached, a decline to 2011.08 could follow (a test from above). Subsequently, a new upward structure to 2037.27 might develop.
S&P 500
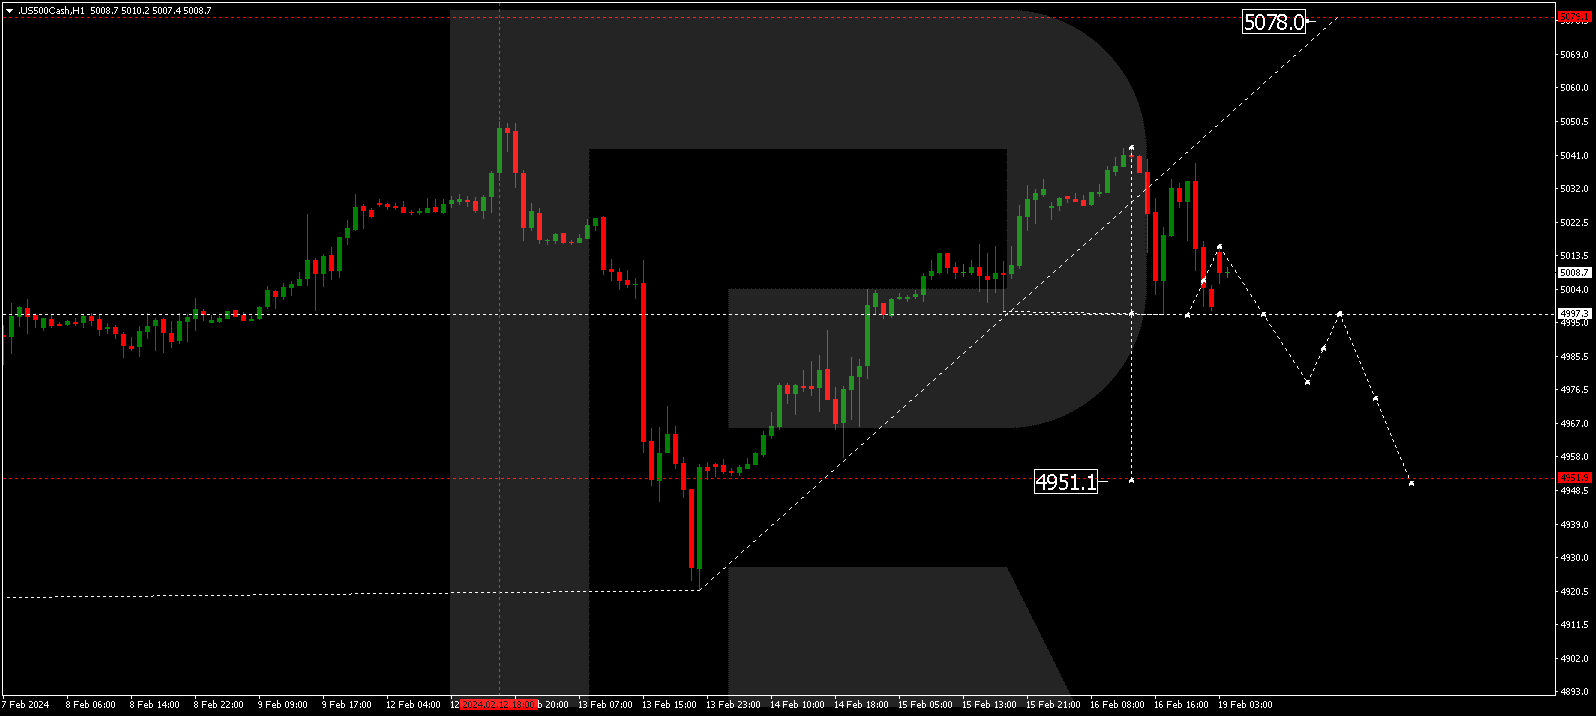
The stock index completed a growth link to 5043.0. Following this, the market underwent a correction to 4997.3. Currently, a consolidation range is forming above this level. A downward breakout from the range may lead to a decline to 4952.0. Conversely, an upward breakout might result in a growth link to 5078.0, followed by a decline to 4952.0. This is the initial target.
The post Technical Analysis & Forecast February 19, 2024 appeared first at R Blog – RoboForex.