
The S&P 500 index might continue its descent. This overview also delves into the dynamics of EUR, GBP, JPY, CHF, AUD, Brent, and Gold.
EUR/USD (Euro vs US Dollar)
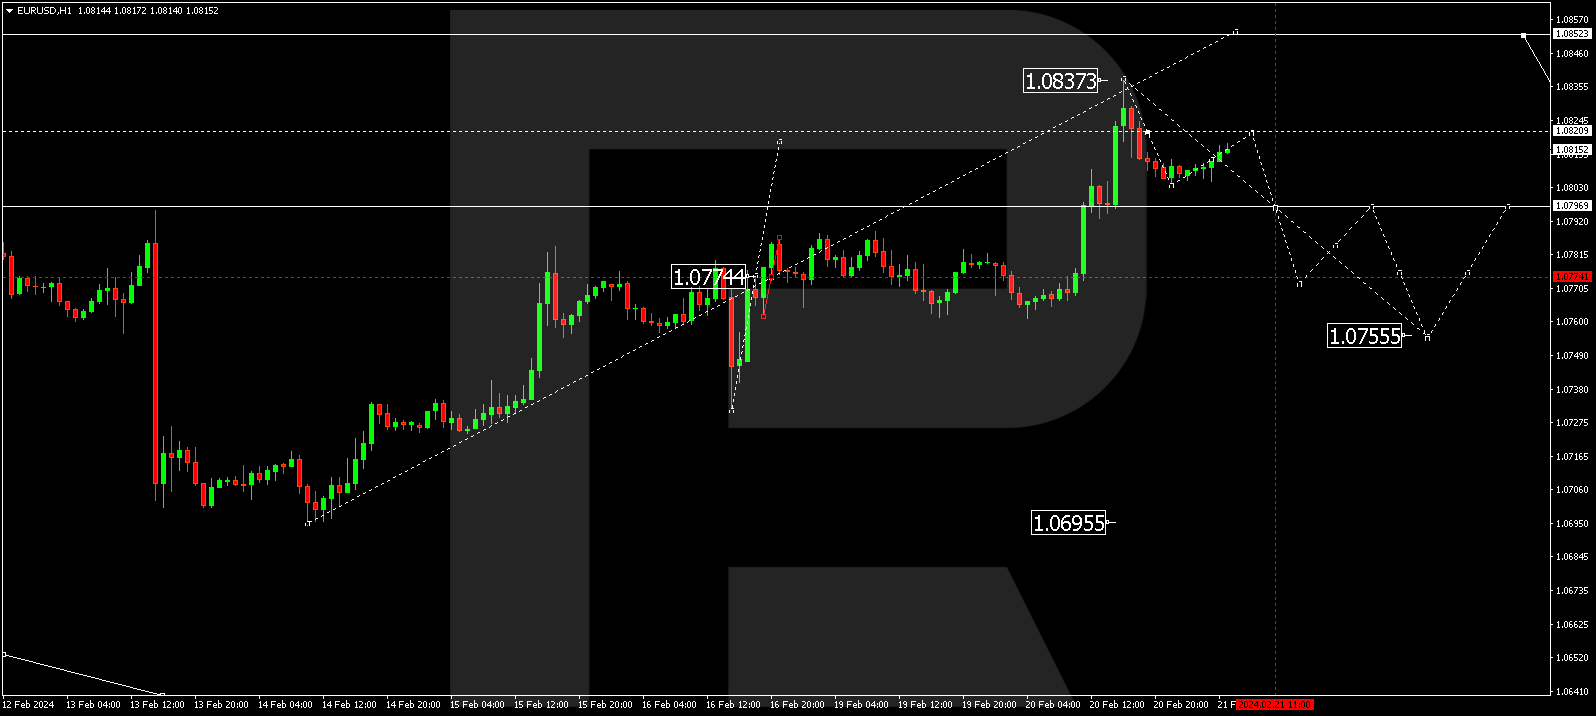
The EUR/USD pair has crafted a structure with an upward surge to 1.0838 and a subsequent downward slide to 1.0803 today. At present, a growth phase to 1.0820 is unfolding. Essentially, new consolidation levels might emerge around these values. A breakout to the upside could see the range expanding to 1.0850. Conversely, a downward breakout could pave the way for a new downward wave to 1.0755. This marks the initial target.
GBP/USD (Great Britain Pound vs US Dollar)
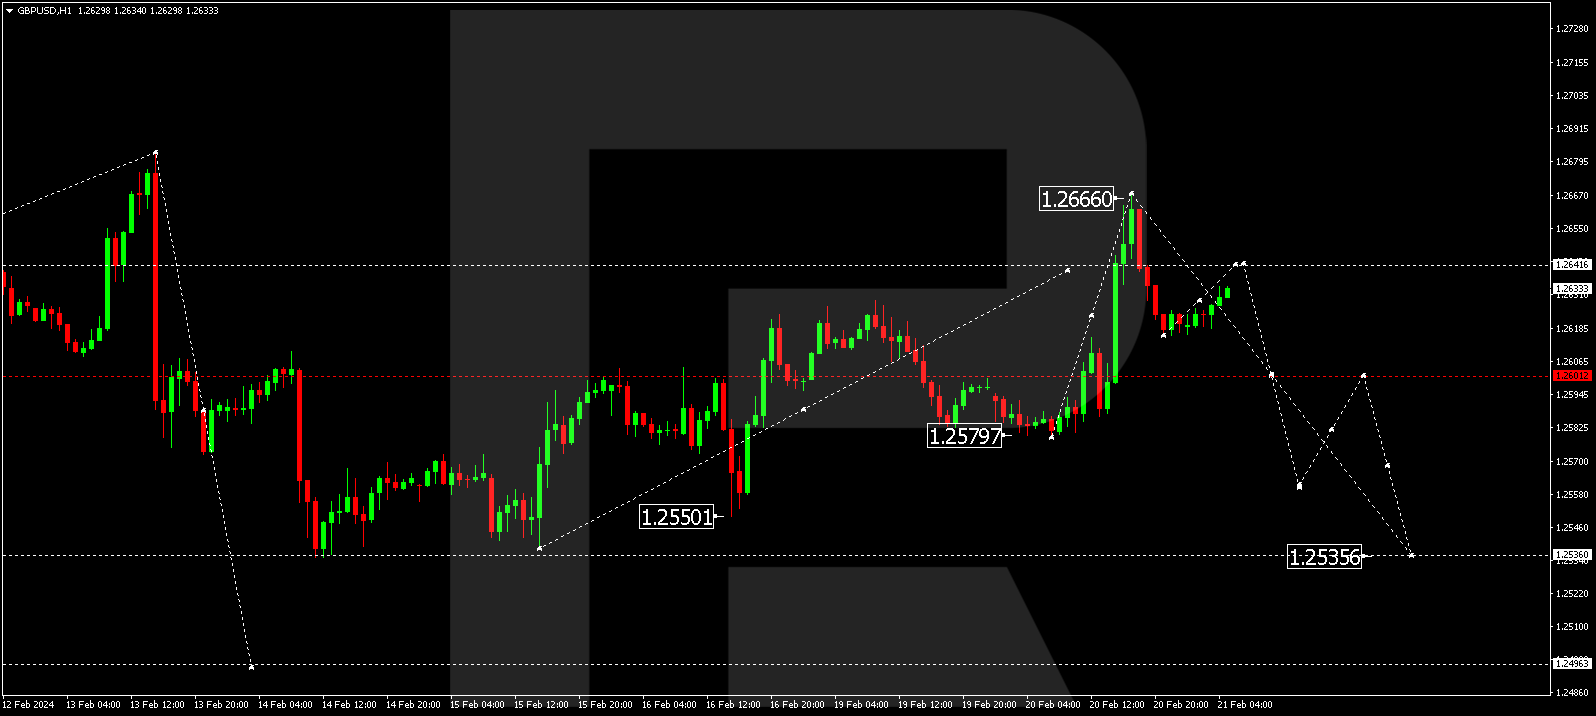
The GBP/USD pair has concluded an upward wave at 1.2660. Currently, a downward momentum to 1.2626 has taken shape. A corrective phase to 1.2642 could materialize today. Once the correction concludes, a fresh downward wave to 1.2560 may commence, extending the trend to 1.2535. This constitutes the initial target.
USD/JPY (US Dollar vs Japanese Yen)
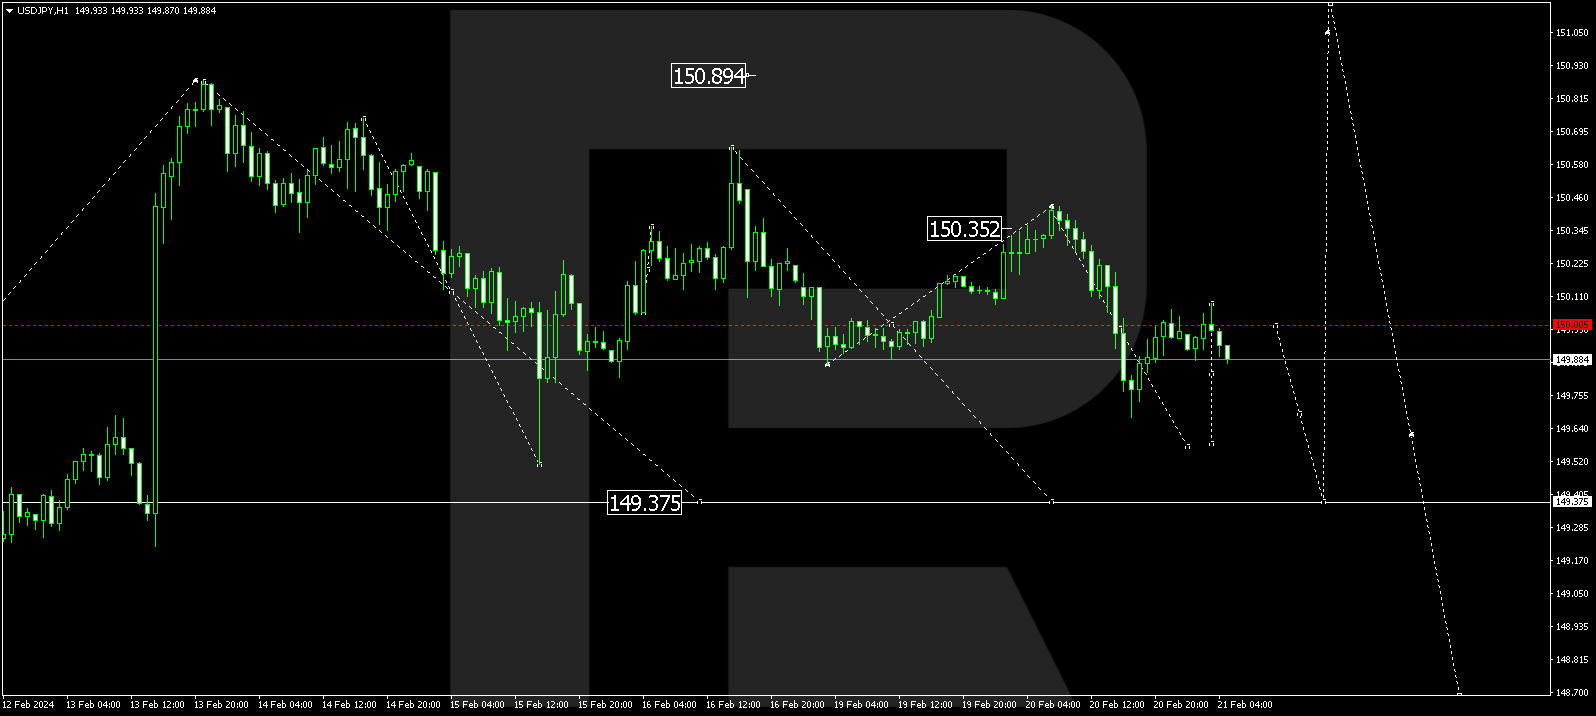
The USD/JPY pair is in the process of unfolding a downward wave to 149.58. Following this, prices might correct to 150.05 (a trial from below). Subsequently, a decline to 149.37 is anticipated. Once this level is attained, a new upward wave to 151.50 could initiate.

USD/CHF (US Dollar vs Swiss Franc)
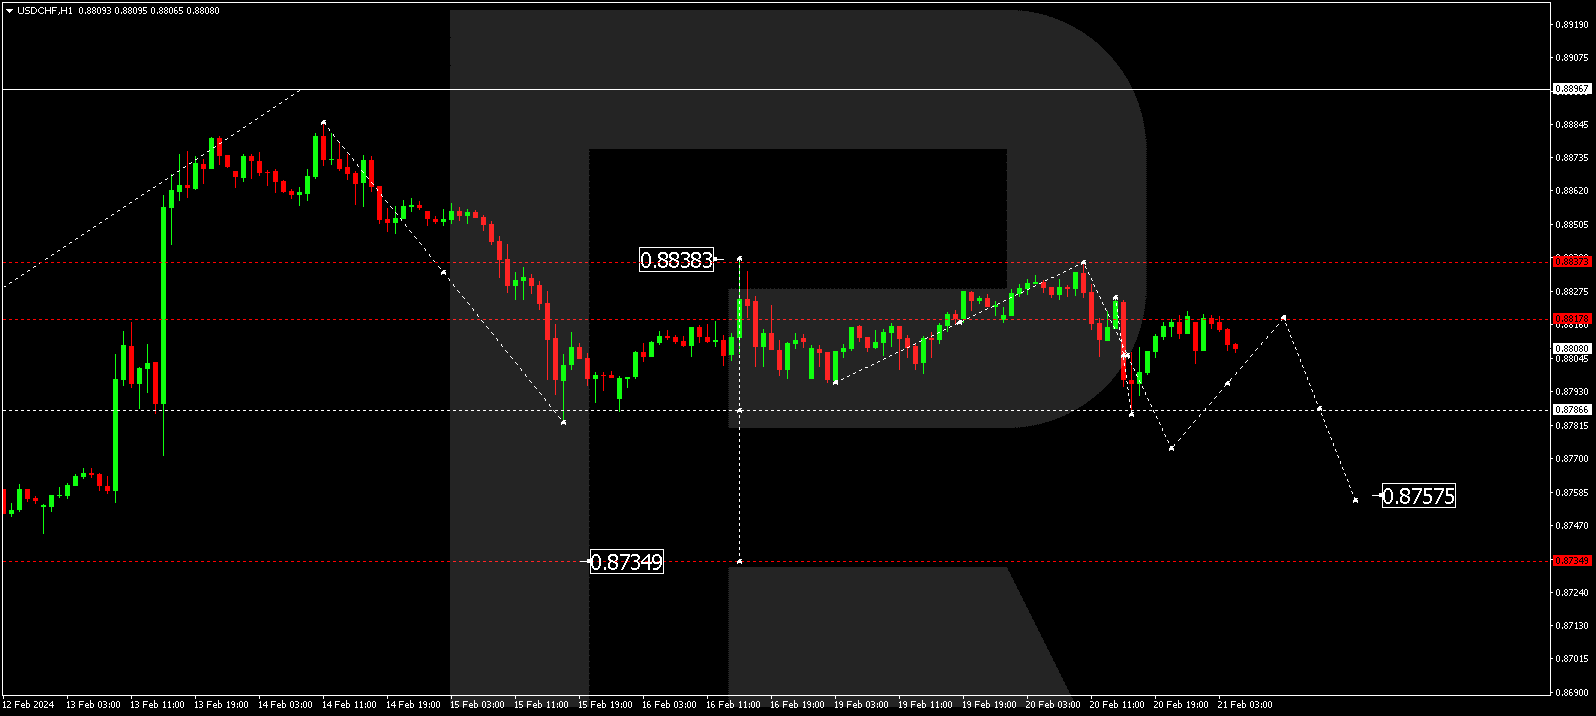
The USD/CHF pair has completed a decline to 0.8785. Today, the market has retraced to the consolidation range around 0.8818. A breakout to the upside could pave the way for an ascent to 0.8880. Conversely, a downward breakout could extend the correction to 0.8757.
AUD/USD (Australian Dollar vs US Dollar)
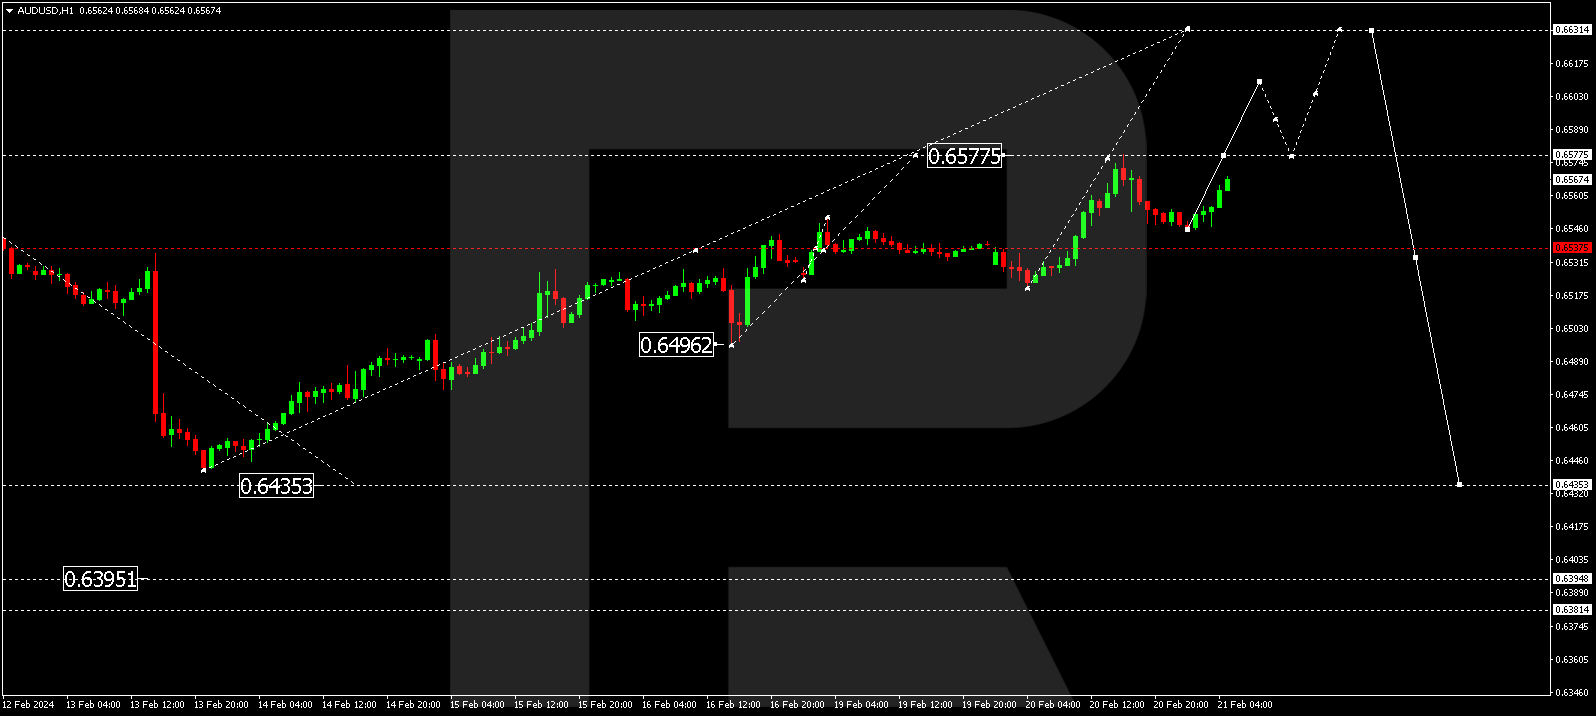
The AUD/USD pair has wrapped up an upward wave at 0.6577. Currently, a consolidation range is shaping up below this level. A downward breakout could continue the descent to 0.6455. Conversely, an upward breakout might extend the correction to 0.6630. Subsequently, a trend-based decline to 0.6455 may ensue. This represents the initial target.
BRENT
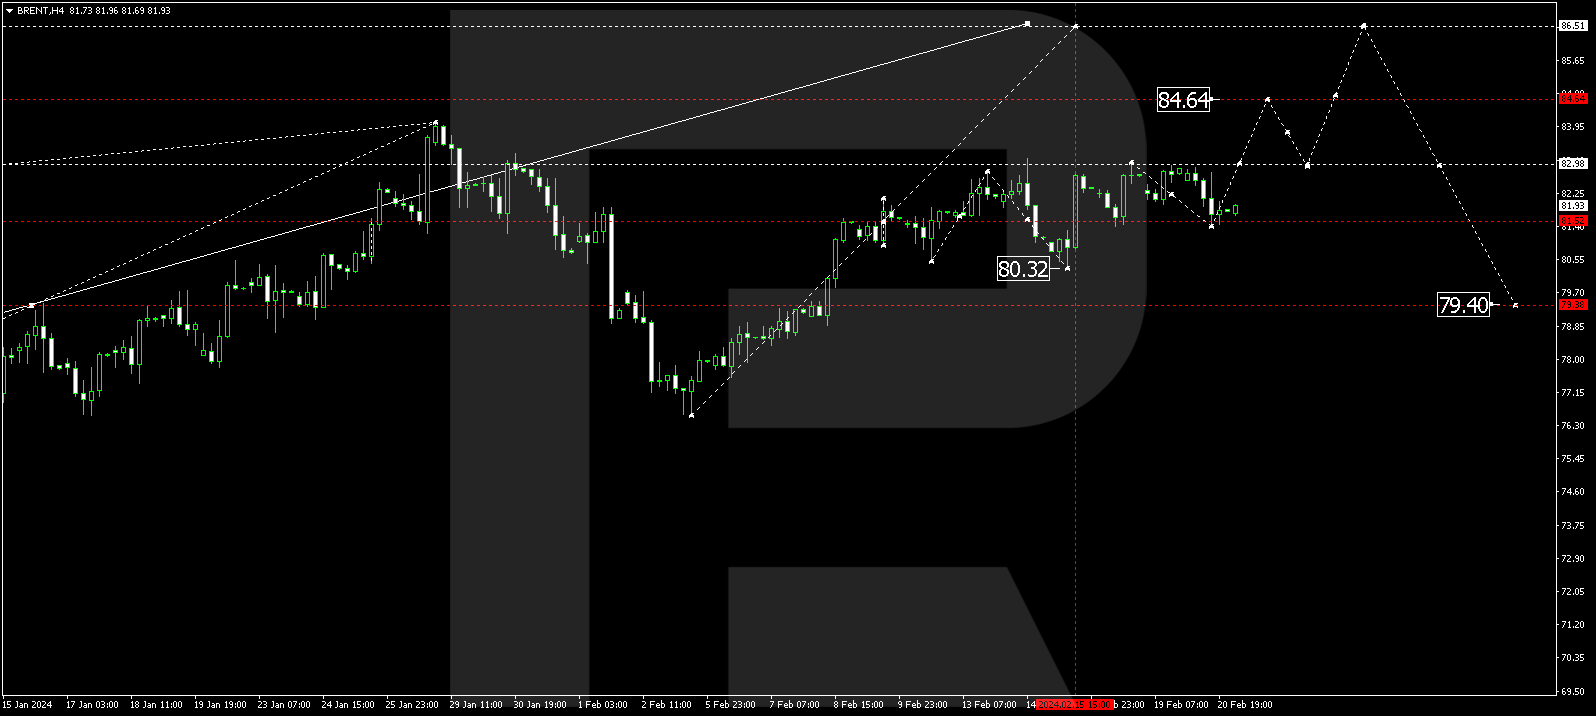
Brent is currently in a consolidation range around 81.52 without a clear trend. An upward breakout could see the continuation of the growth wave to 84.64, leading to a potential trend continuation to 86.50. This is the initial target.
XAU/USD (Gold vs US Dollar)
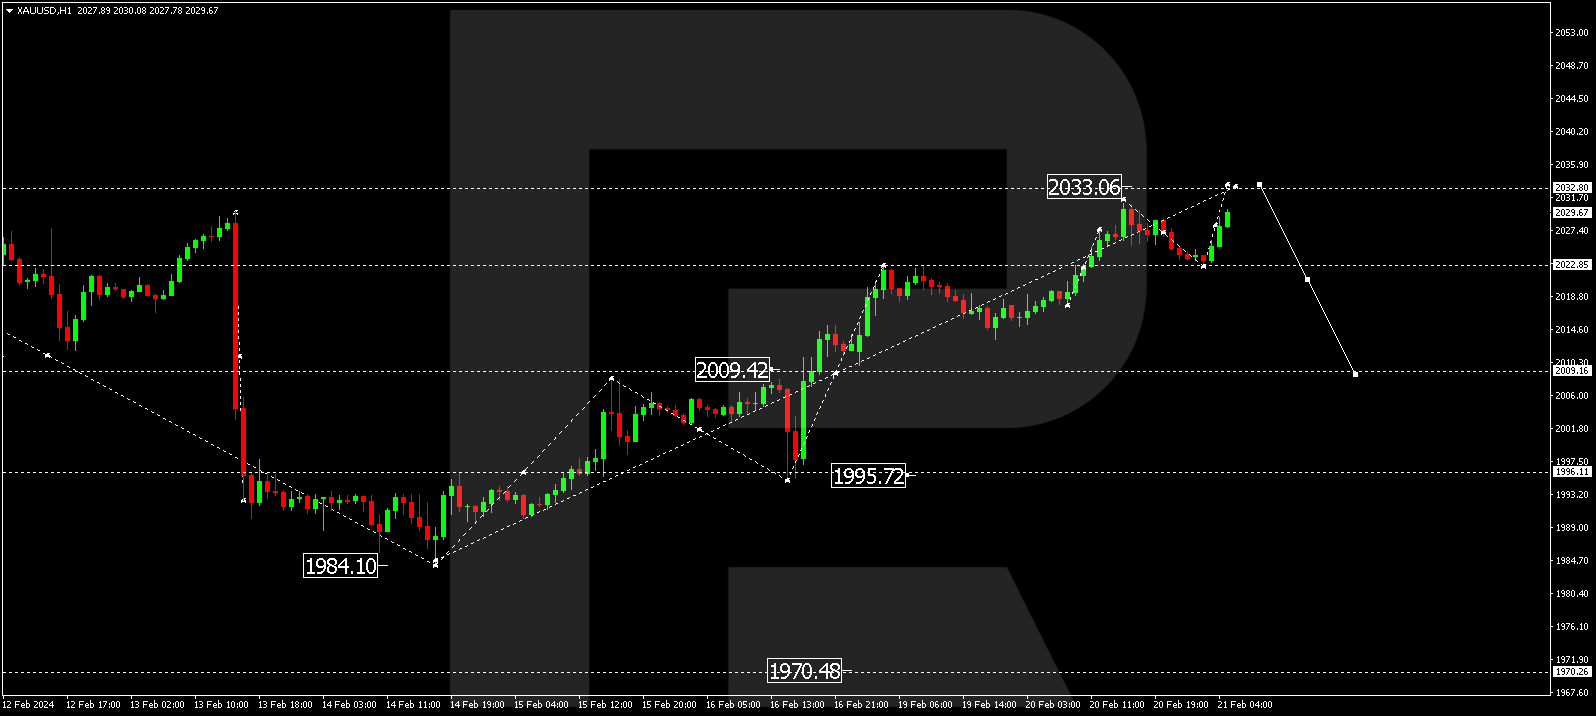
Gold is extending an upward wave to 2033.00. After reaching this level, a new downward wave to 2009.00 is anticipated to commence. This is the initial target.
S&P 500
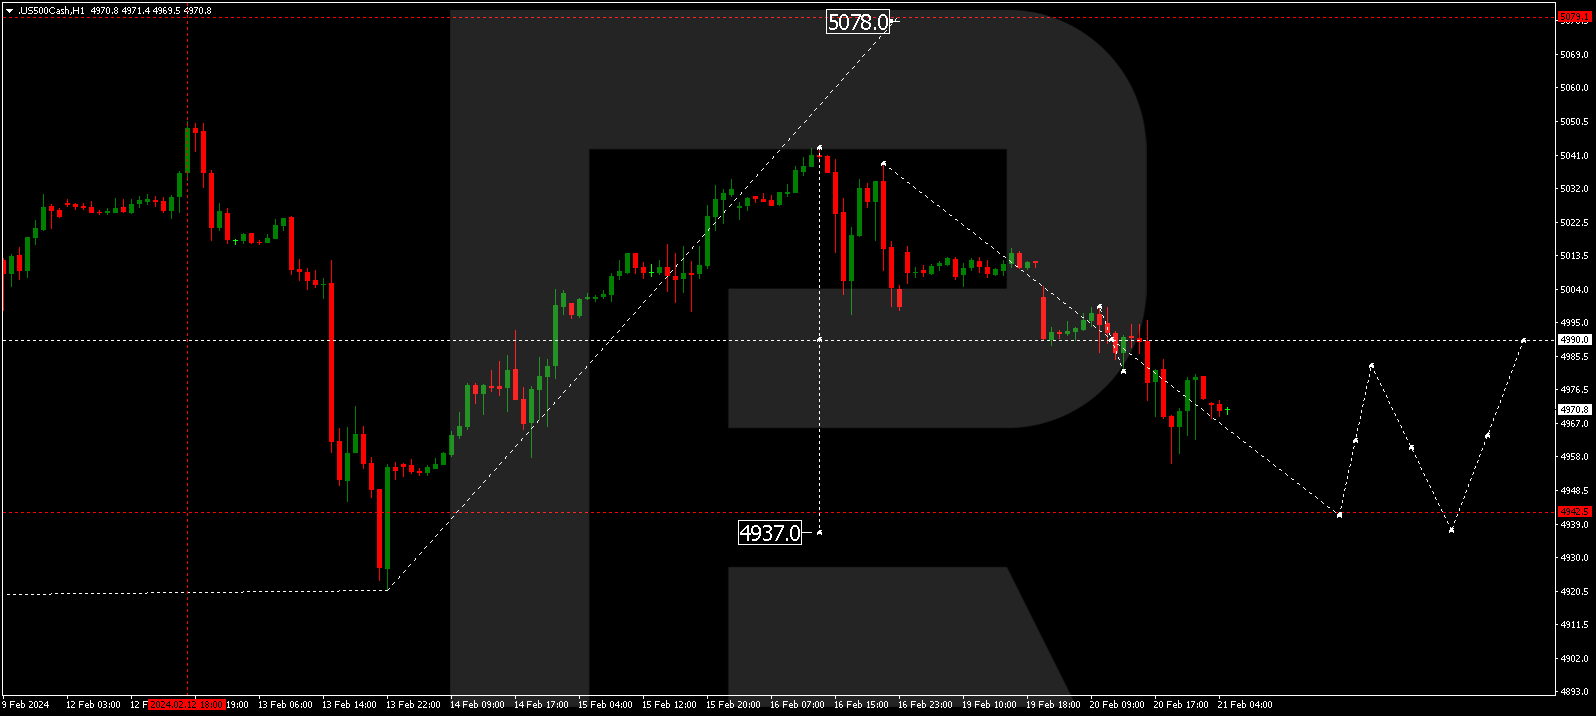
The stock index has completed a downward wave structure to 4956.1. A correction to 4990.0 is plausible today (a test from below). Subsequently, a decline to 4942.5 may manifest. This is a local target.
The post Technical Analysis & Forecast February 21, 2024 appeared first at R Blog – RoboForex.