
EUR may undergo a correction in the current declining wave. The overview also encompasses the dynamics of GBP, JPY, CHF, AUD, Brent, Gold, and the S&P 500 index.
EUR/USD (Euro vs US Dollar)
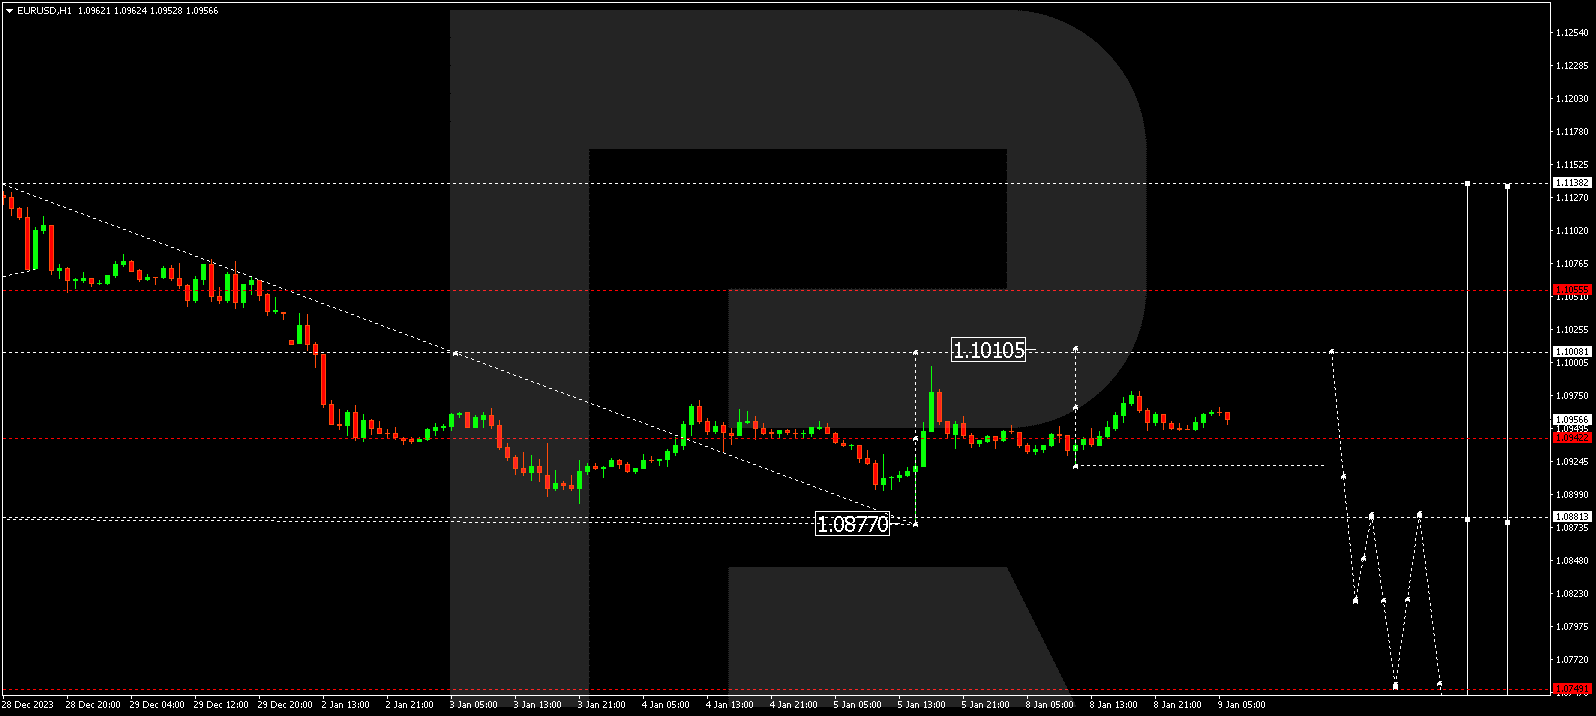
EUR/USD has completed the initial decline wave to 1.0877. Today, a consolidation range around 1.0942 is conceivable. An upward breakout could lead to a correction to at least 1.1010, while a downward breakout may extend the wave further to 1.0750. This represents a local target.
GBP/USD (Great Britain Pound vs US Dollar)
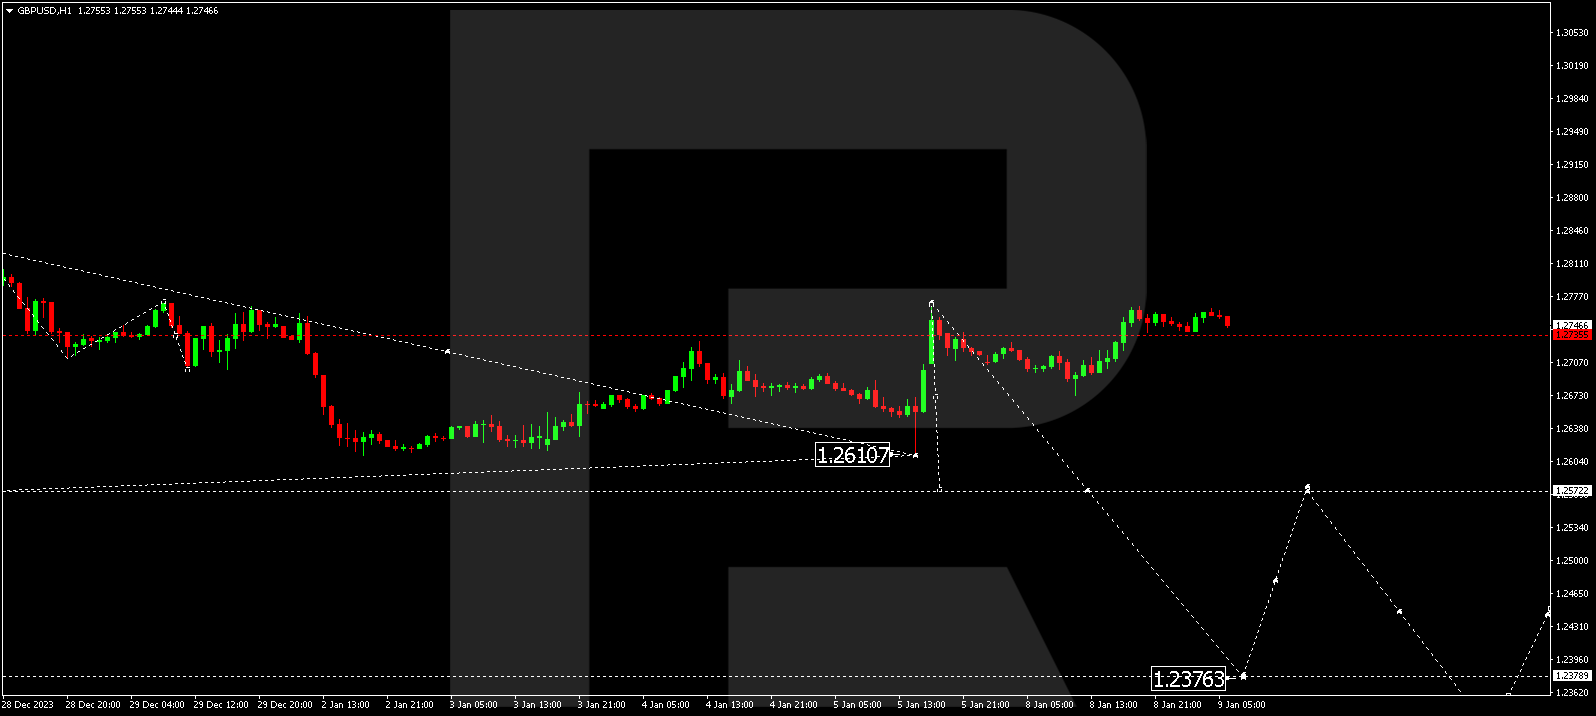
GBP/USD has finished a decline wave to 1.2611 and a correction to 1.2769. An anticipated consolidation range is expected around 1.2735. An upward breakout may extend the correction to 1.2790, whereas a downward breakout opens the potential for a new decline wave to 1.2570. A breach of this level could further the decline to 1.2377, representing a local target.
USD/JPY (US Dollar vs Japanese Yen)
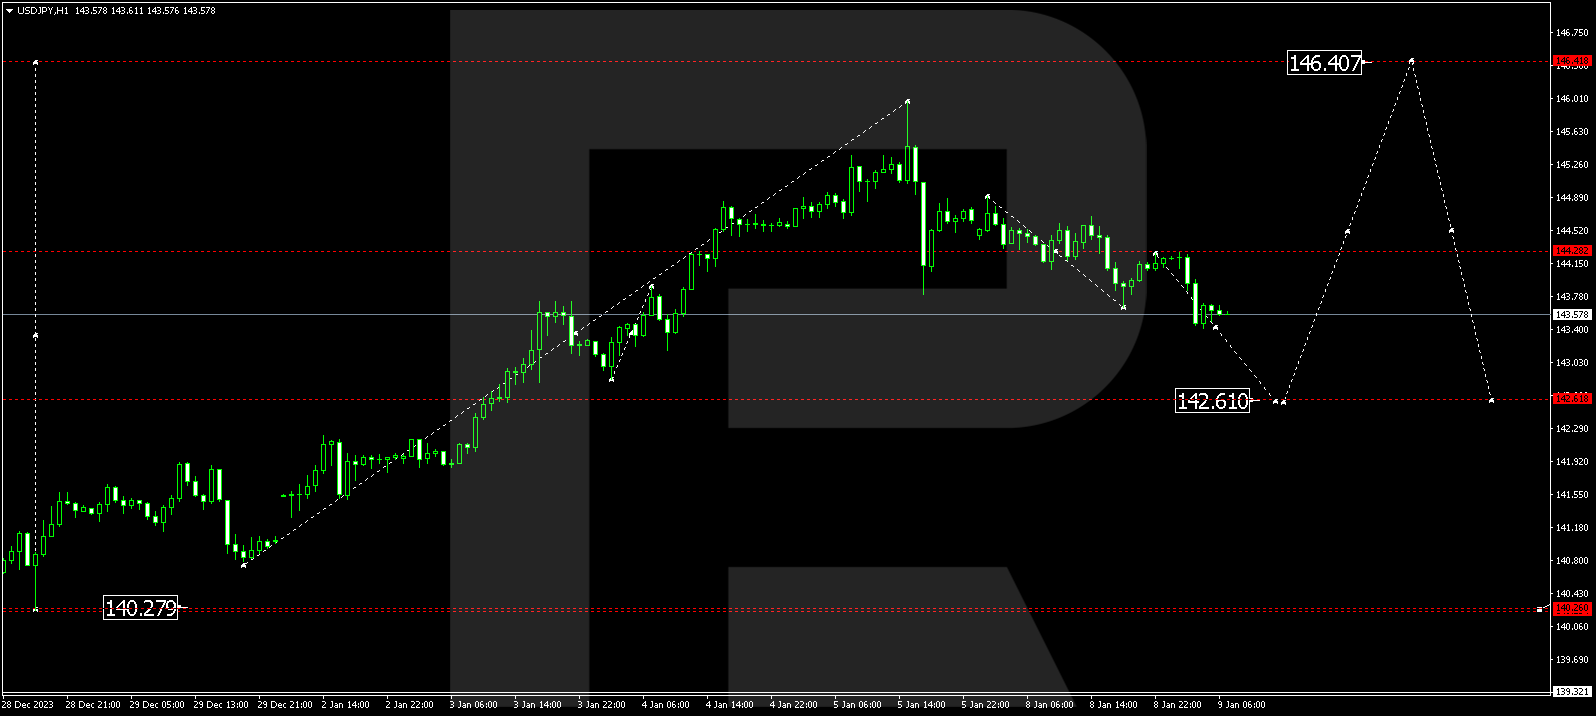
USD/JPY has completed a growth wave to 145.95, marking a local target. Today, a correction extending to 142.61 is expected. After completion, a new growth wave to 146.40 could evolve, representing the first target.


USD/CHF (US Dollar vs Swiss Franc)
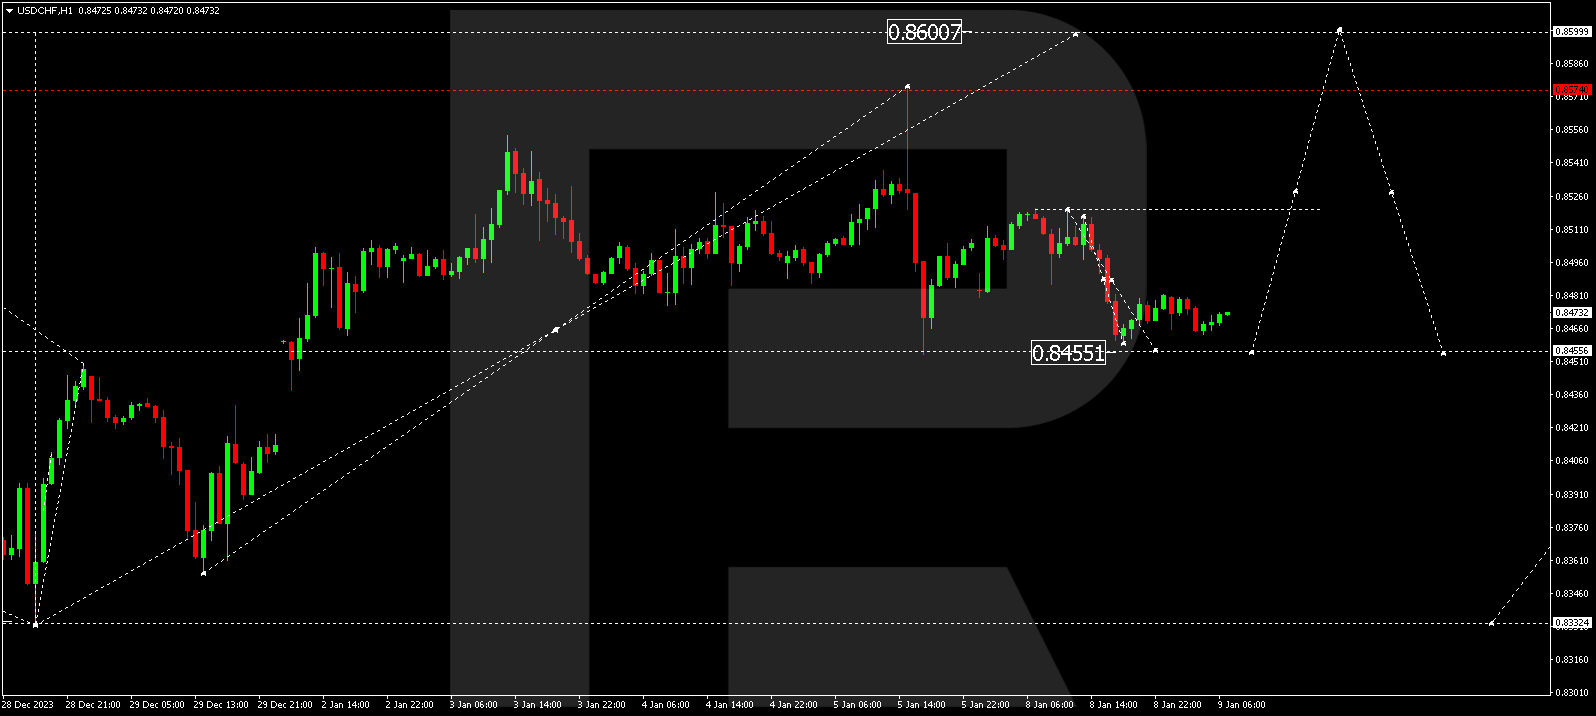
USD/CHF has completed a growth wave structure to 0.8574, marking a local target. Currently correcting to 0.8455, a consolidation range is forming above this level today. A downward breakout might extend the correction to 0.8410, while an upward breakout could propel the growth wave to 0.8600, representing the first target.
AUD/USD (Australian Dollar vs US Dollar)
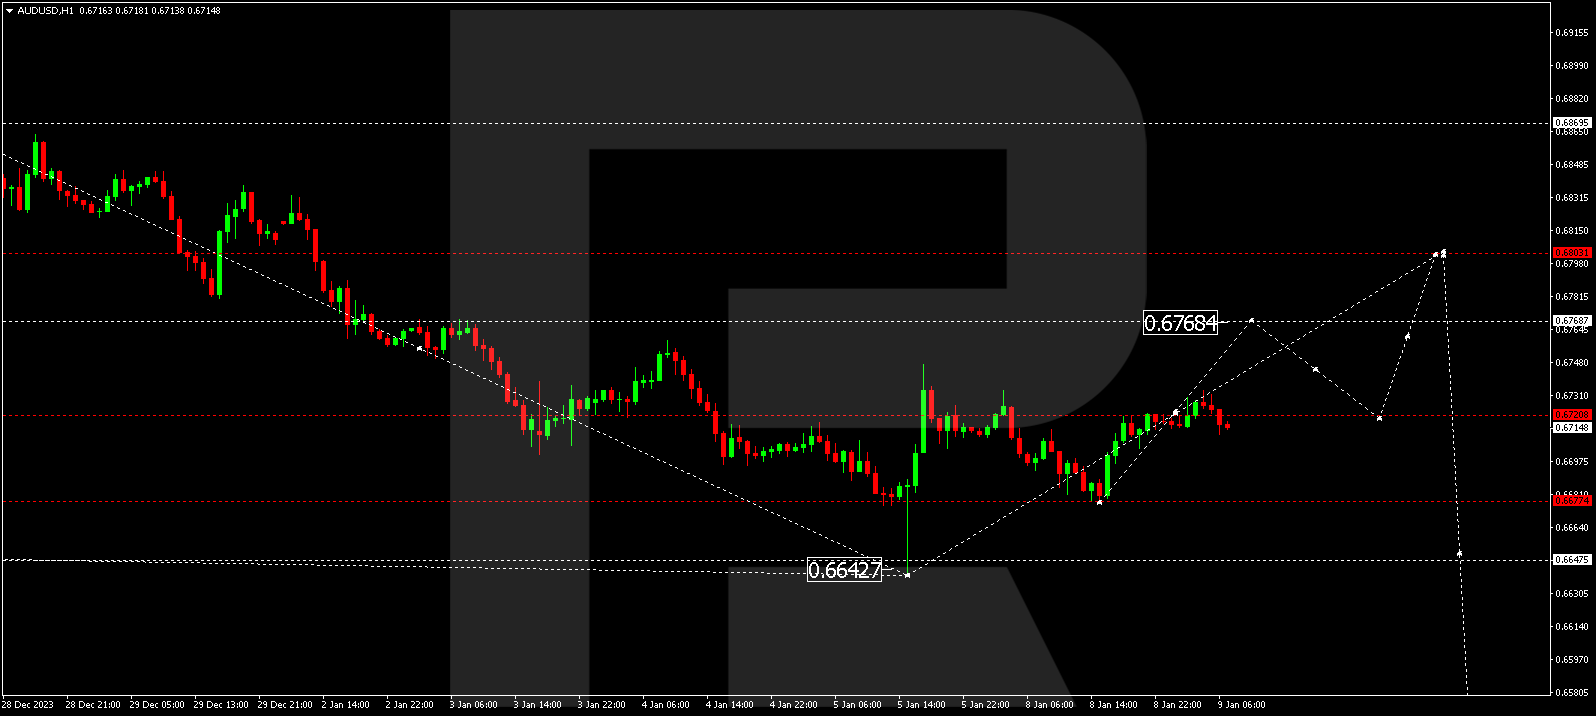
AUD/USD has completed a decline wave to 0.6644 and a correction to 0.6746. A consolidation range is expected around 0.6720 today. An upward breakout may extend the correction to 0.6768, while a downward breakout opens the potential for a decline wave to 0.6640. A breach of this level could continue the trend to 0.6500.
BRENT
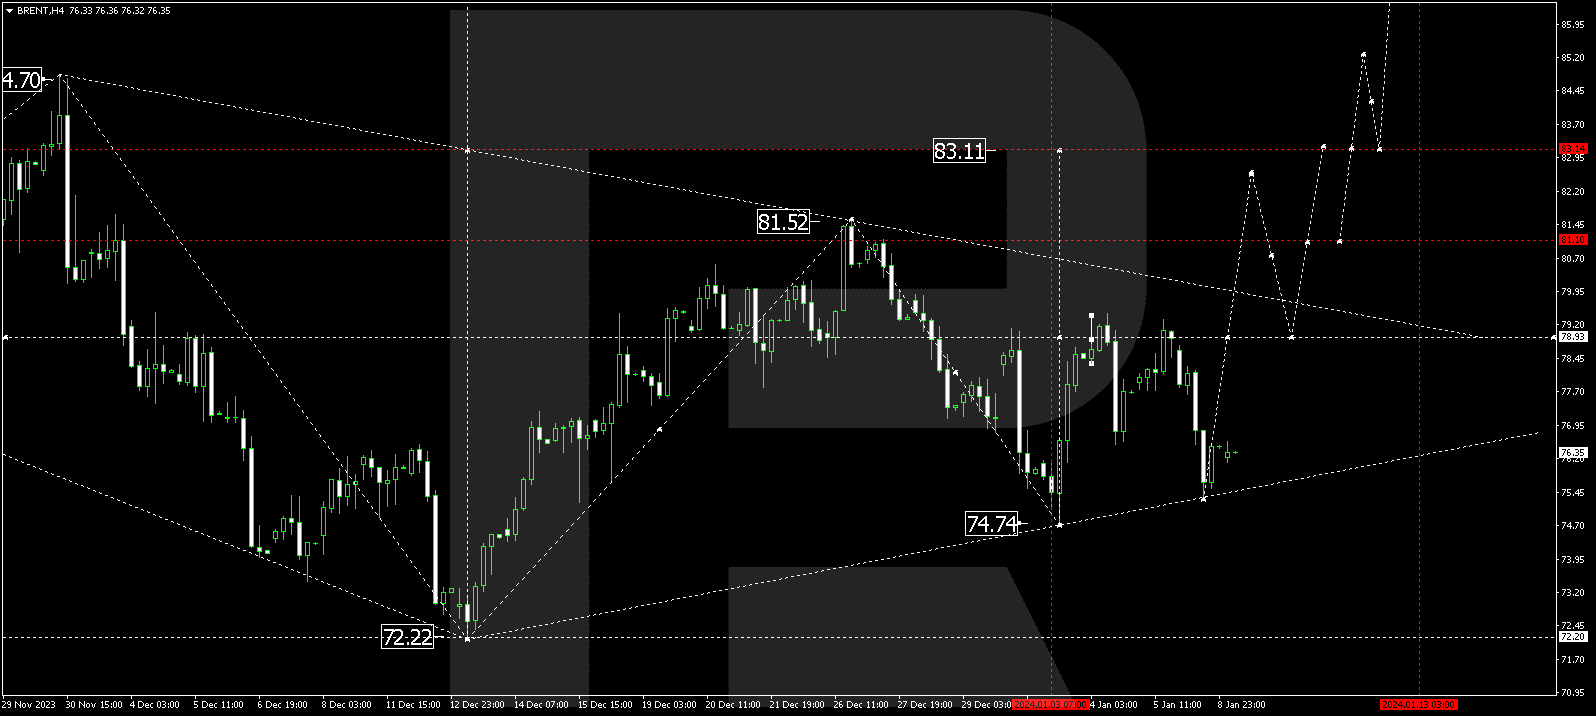
Brent is still developing a consolidation range around 78.93. An upward breakout might open the potential for a growth wave to 83.15, extending the trend to 91.50. Conversely, a downward breakout could continue the correction to 70.00, after which a new growth wave to 95.00 might commence.
XAU/USD (Gold vs US Dollar)
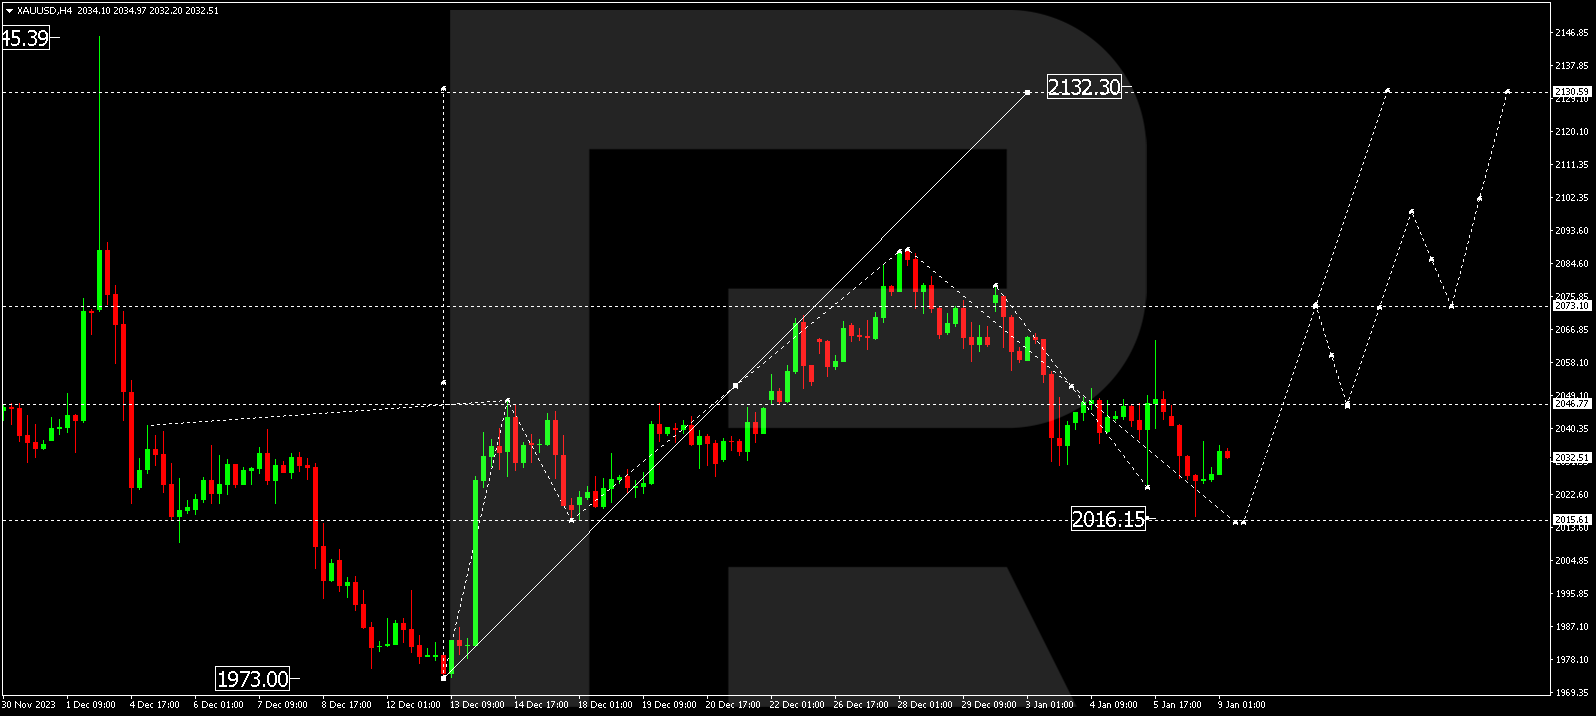
Gold has completed a growth wave at 2088.30. Today’s correction might extend to 2015.66. Afterward, a growth wave to 2130.60 could commence, representing the first target.
S&P 500
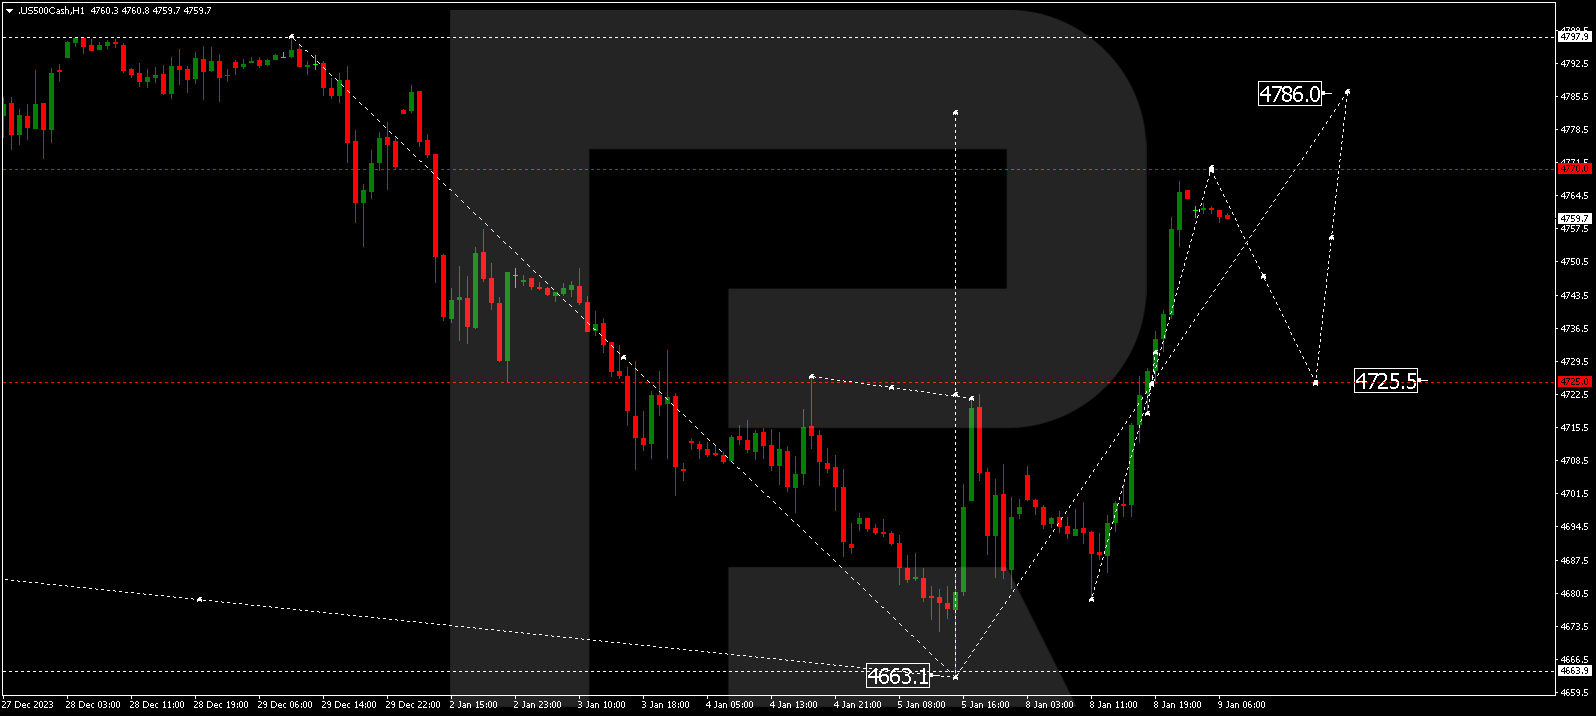
The stock index is still developing a consolidation range around 4725.5. Today, it might expand to 4770.0. Subsequently, a correction to 4725.5 (a test from above) could occur. Once the correction concludes, a growth link to 4786.0 is anticipated.
The post Technical Analysis & Forecast January 09, 2024 appeared first at R Blog – RoboForex.