
Brent Consolidates Before Potential Growth. This overview also examines the dynamics of EUR, GBP, JPY, CHF, AUD, Gold, and the S&P 500 index.
EUR/USD (Euro vs US Dollar)
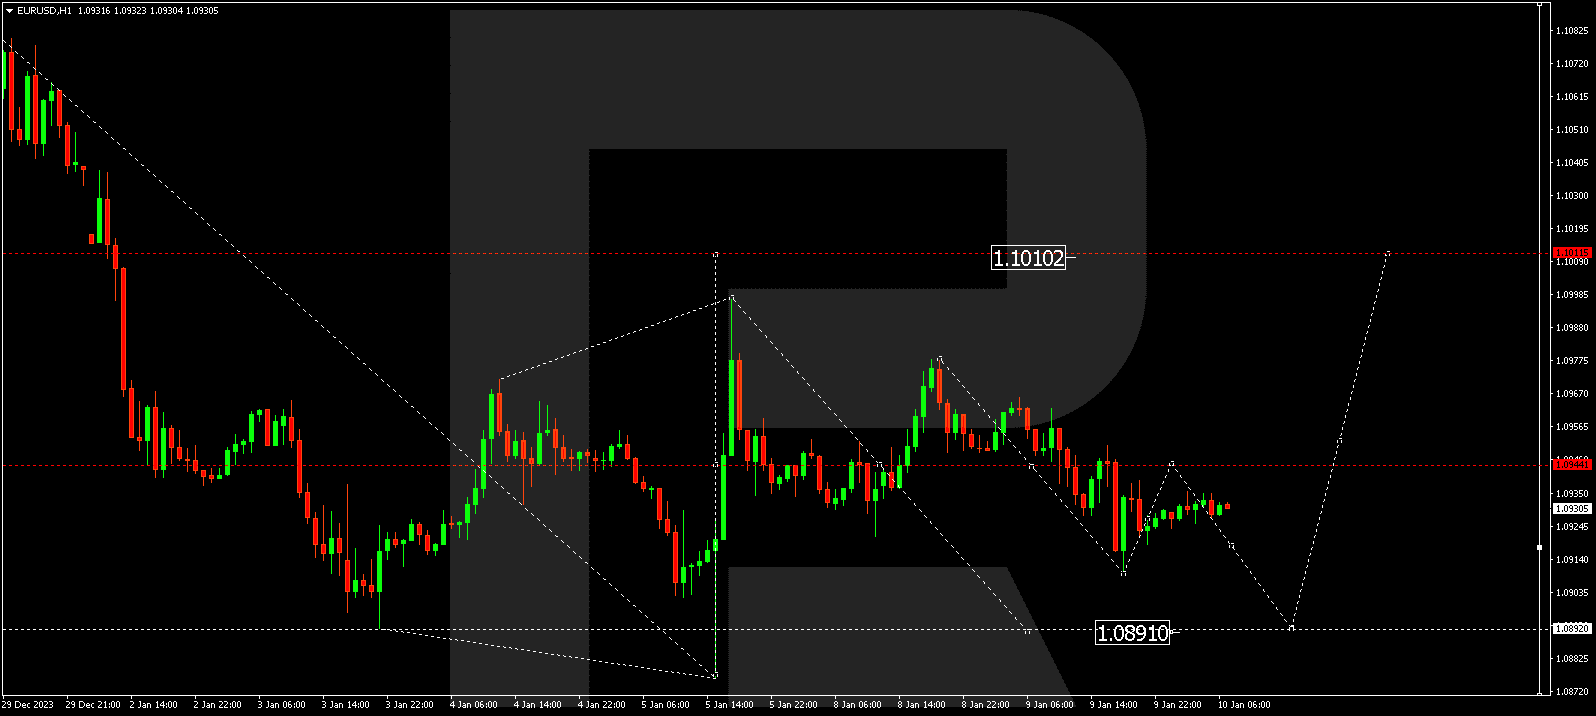
EUR/USD is in a consolidation phase around 1.0944, lacking a clear trend. A breakout above the range could trigger a correction to 1.1010. Conversely, a downward breakout may open the door to a decline wave to 1.0733, representing the initial target.
GBP/USD (Great Britain Pound vs US Dollar)
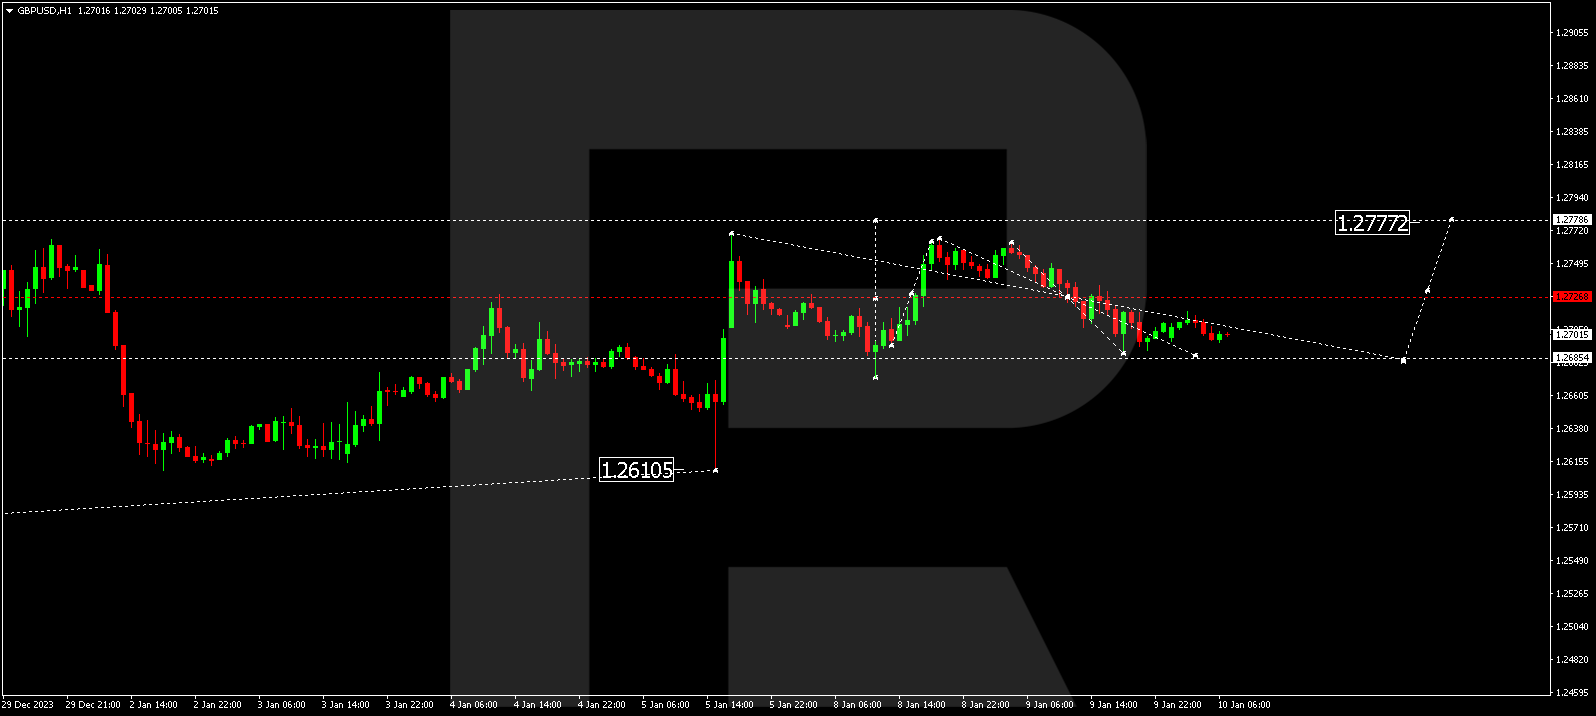
GBP/USD continues to consolidate around 1.2727 without a distinct trend. A decline to 1.2685 is anticipated, followed by a potential extension of the range to 1.2777, after which a decline wave to 1.2500 might initiate.
USD/JPY (US Dollar vs Japanese Yen)
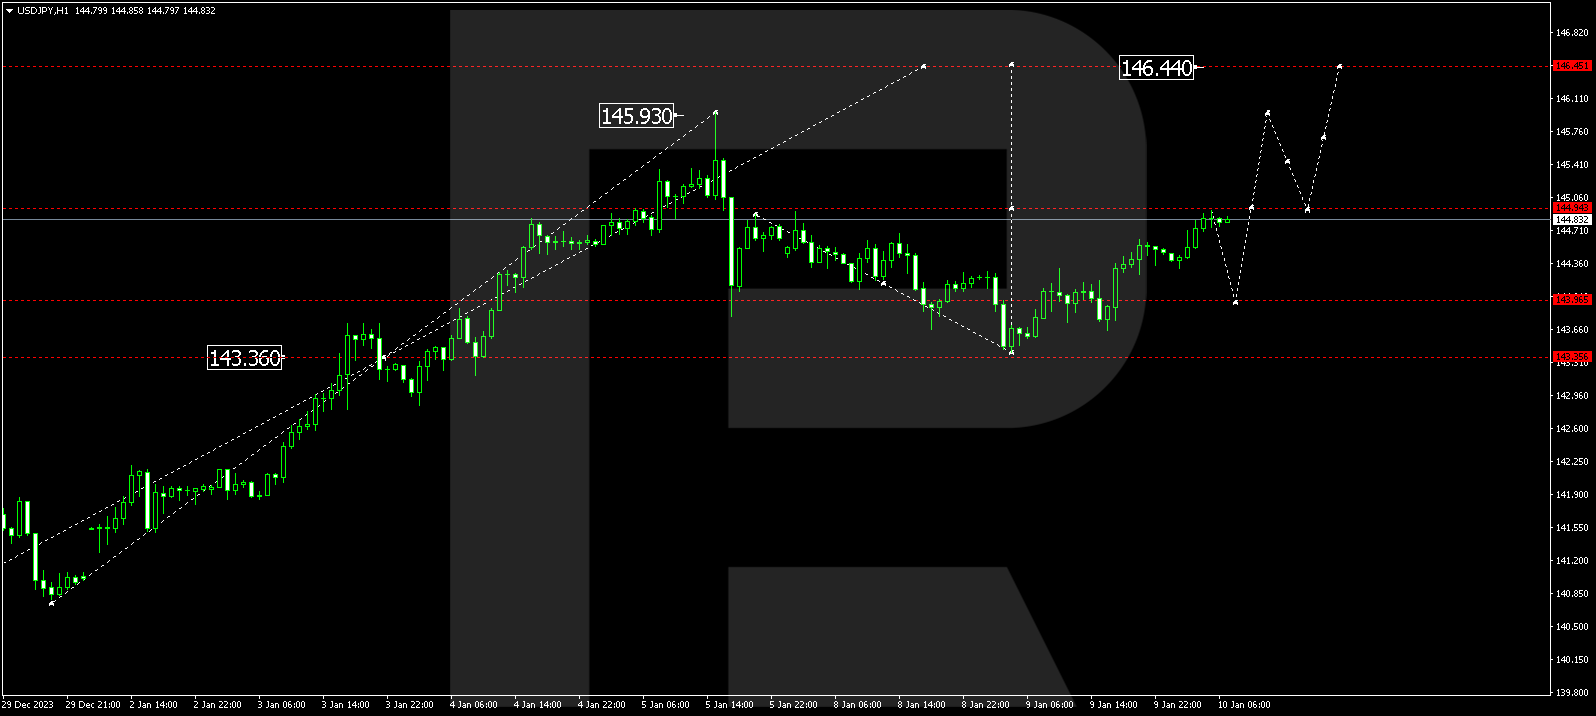
USD/JPY completed a growth wave to 144.94. A correction to 143.95 is expected, and upon completion, a new growth wave to 146.44 might ensue, representing the first target.


USD/CHF (US Dollar vs Swiss Franc)
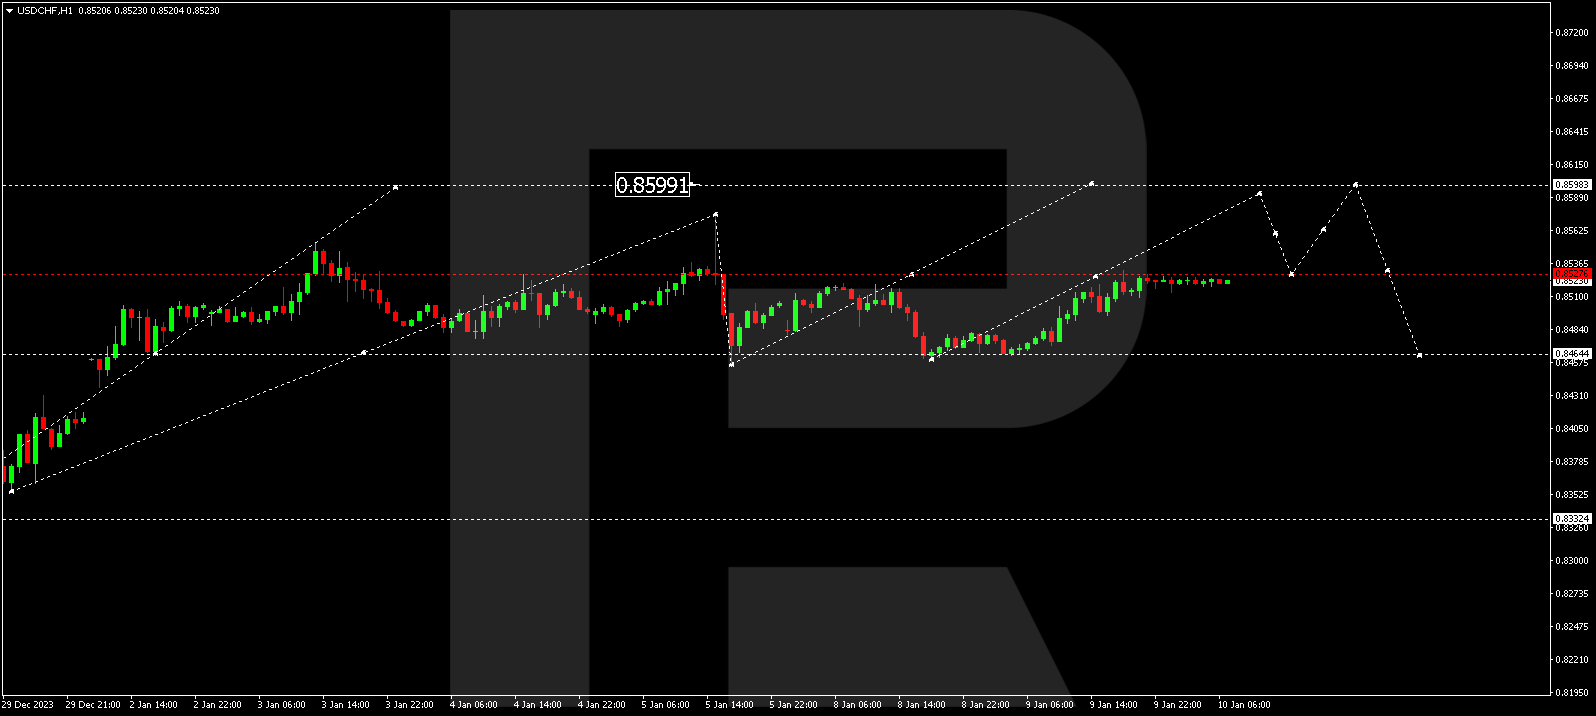
USD/CHF is consolidating below 0.8527. An upward breakout may lead to a growth potential of 0.8598 (first target), followed by an anticipated correction to 0.8464.
AUD/USD (Australian Dollar vs US Dollar)
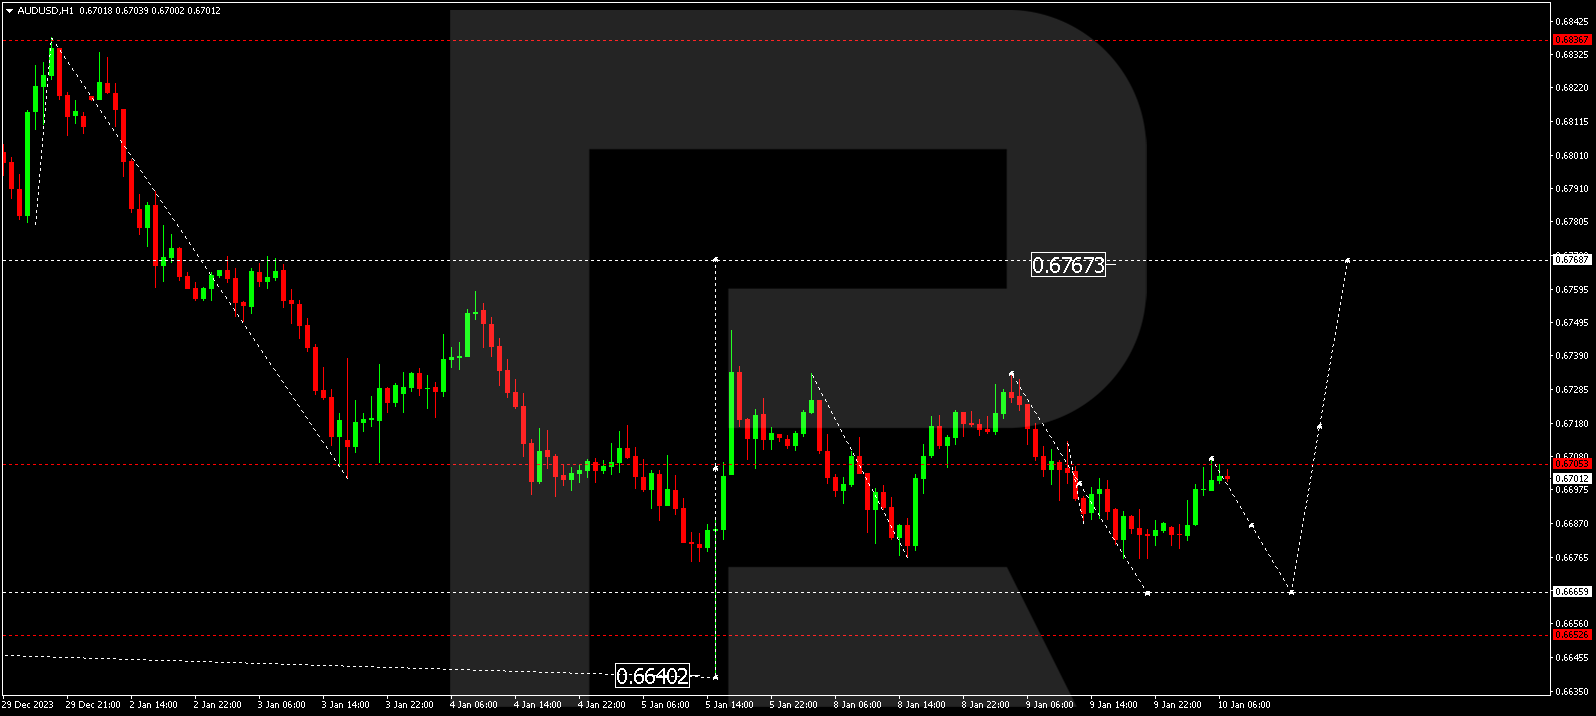
AUD/USD is consolidating around 0.6705 without a clear trend. A decline to 0.6666 is expected, followed by a corrective wave to 0.6767, and subsequently, a decline to 0.6600.
BRENT
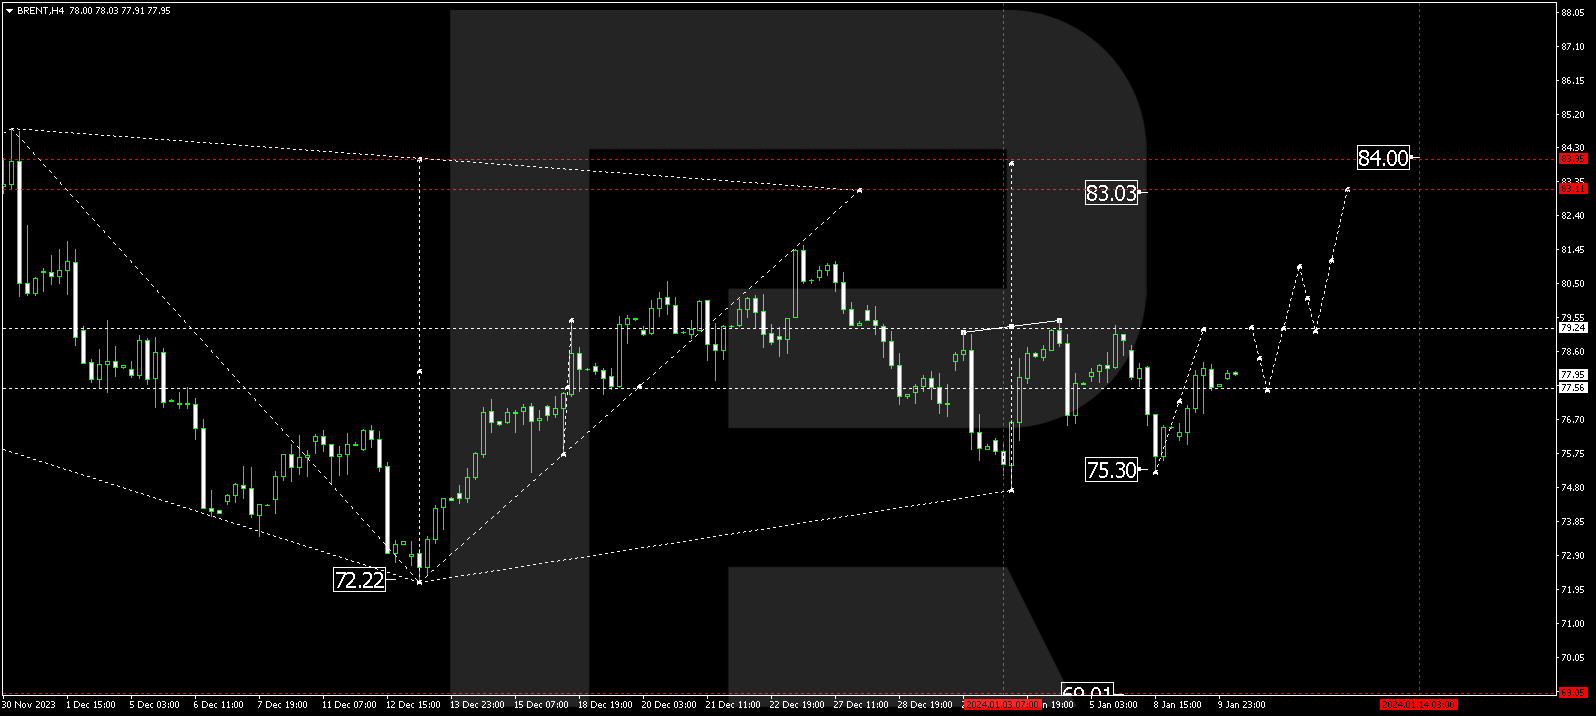
Brent is in a consolidation range around 77.55 without a pronounced trend. An upward breakout may indicate a potential growth wave to 83.15, extending further to 91.50. Conversely, a downward breakout might lead to a correction to 70.00, followed by a projected growth wave to 95.00.
XAU/USD (Gold vs US Dollar)
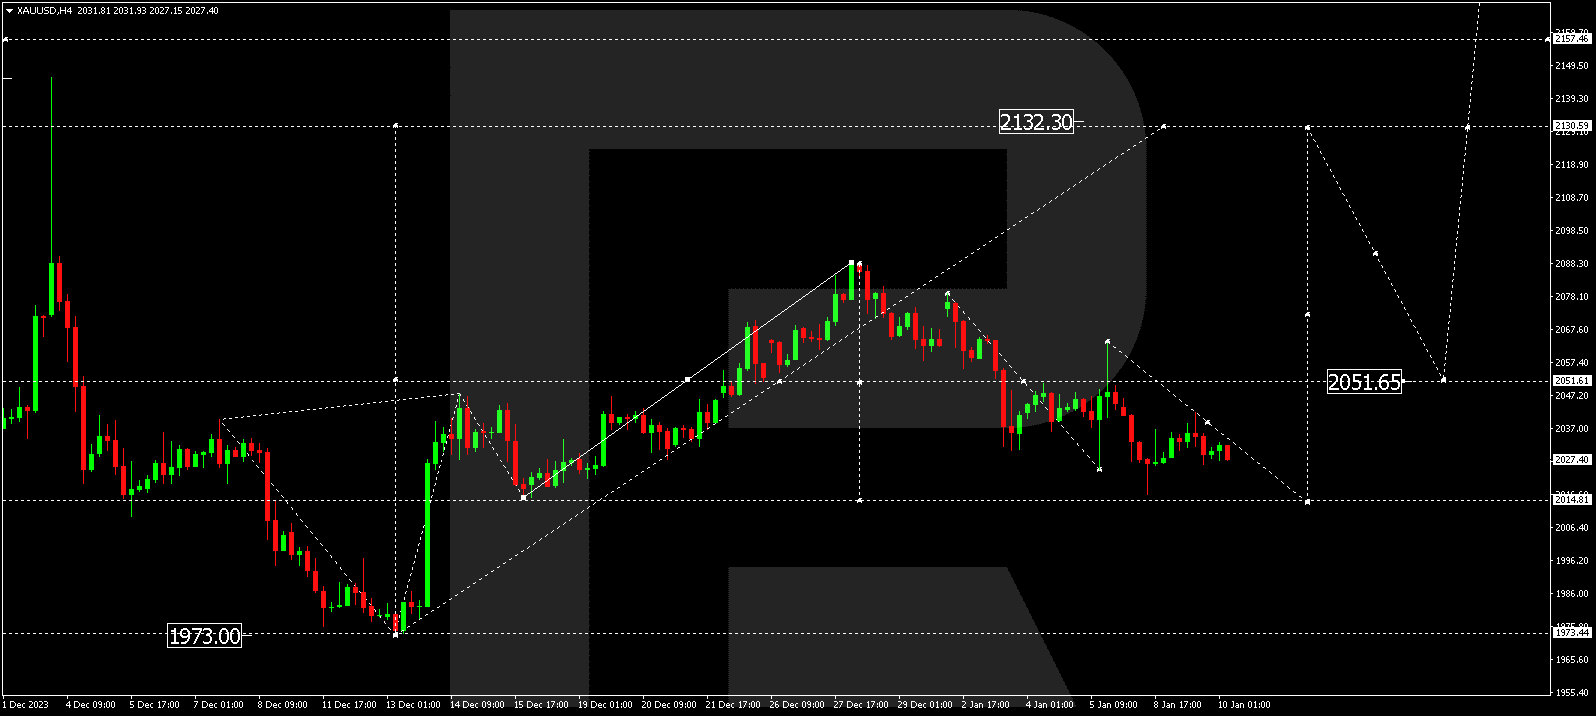
Gold is in a declining wave to 2014.80. After reaching this level, a new growth wave to 2131.78 might commence, followed by a corrective decline to 2051.55. Another growth wave to 2155.00 is anticipated.
S&P 500
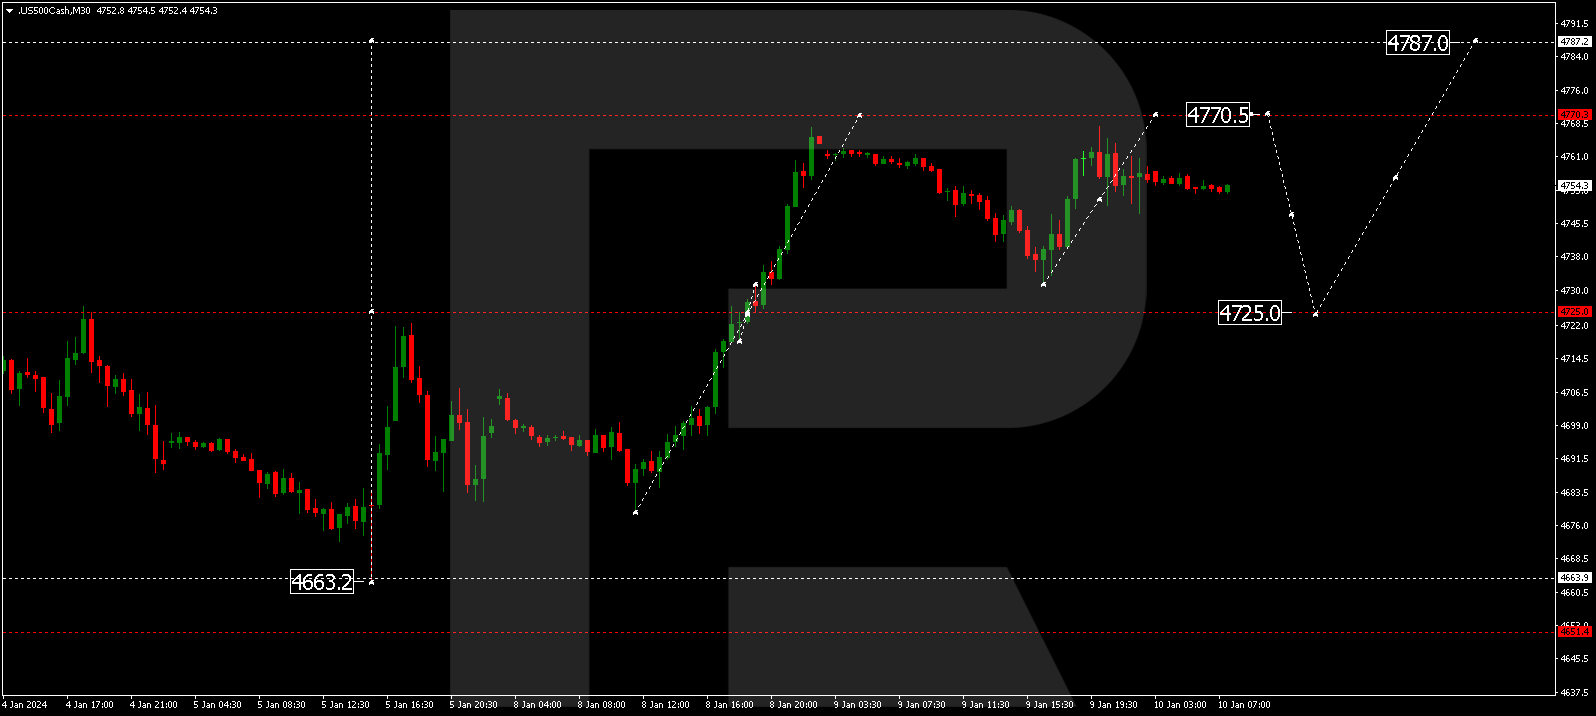
The stock index is in a consolidation range around 4725.5. A growth move to 4770.5 is anticipated, followed by a correction to 4725.0. Once this correction concludes, a new growth structure to 4787.0 may unfold.
The post Technical Analysis & Forecast January 10, 2024 appeared first at R Blog – RoboForex.