
EUR sustains a downtrend, and the overview includes insights into GBP, JPY, CHF, AUD, Brent, Gold, and the S&P 500 index.
EUR/USD (Euro vs US Dollar)
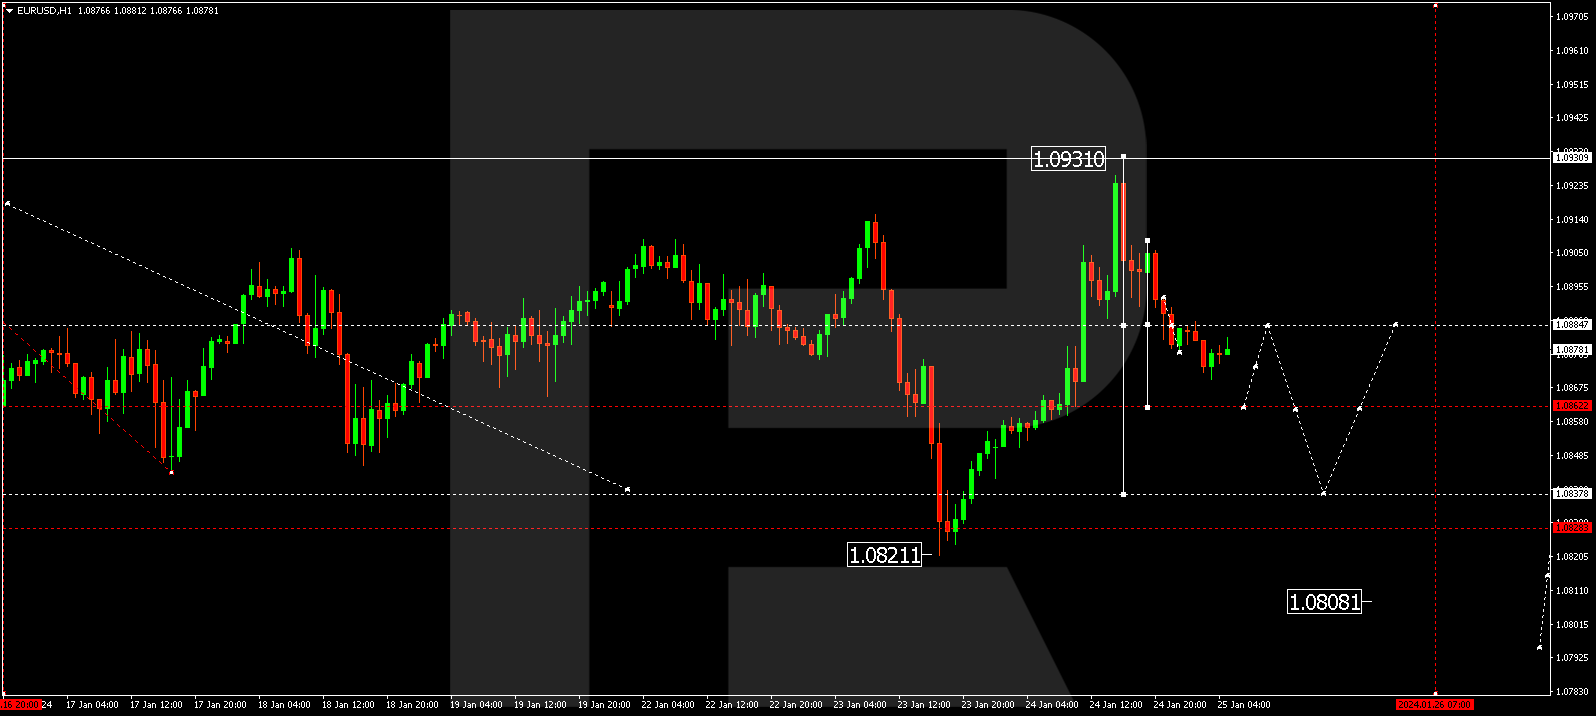
EUR/USD has concluded a correction wave, reaching 1.0931 (tested from below), and initiated a downward impulse to 1.0889, followed by a correction to 1.0907 today. The second decline impulse to 1.0862 is presently taking shape. Once this level is achieved, there could be a correction to 1.0884 (tested from below), subsequently dropping to 1.0833. This marks the first target.
GBP/USD (Great Britain Pound vs US Dollar)
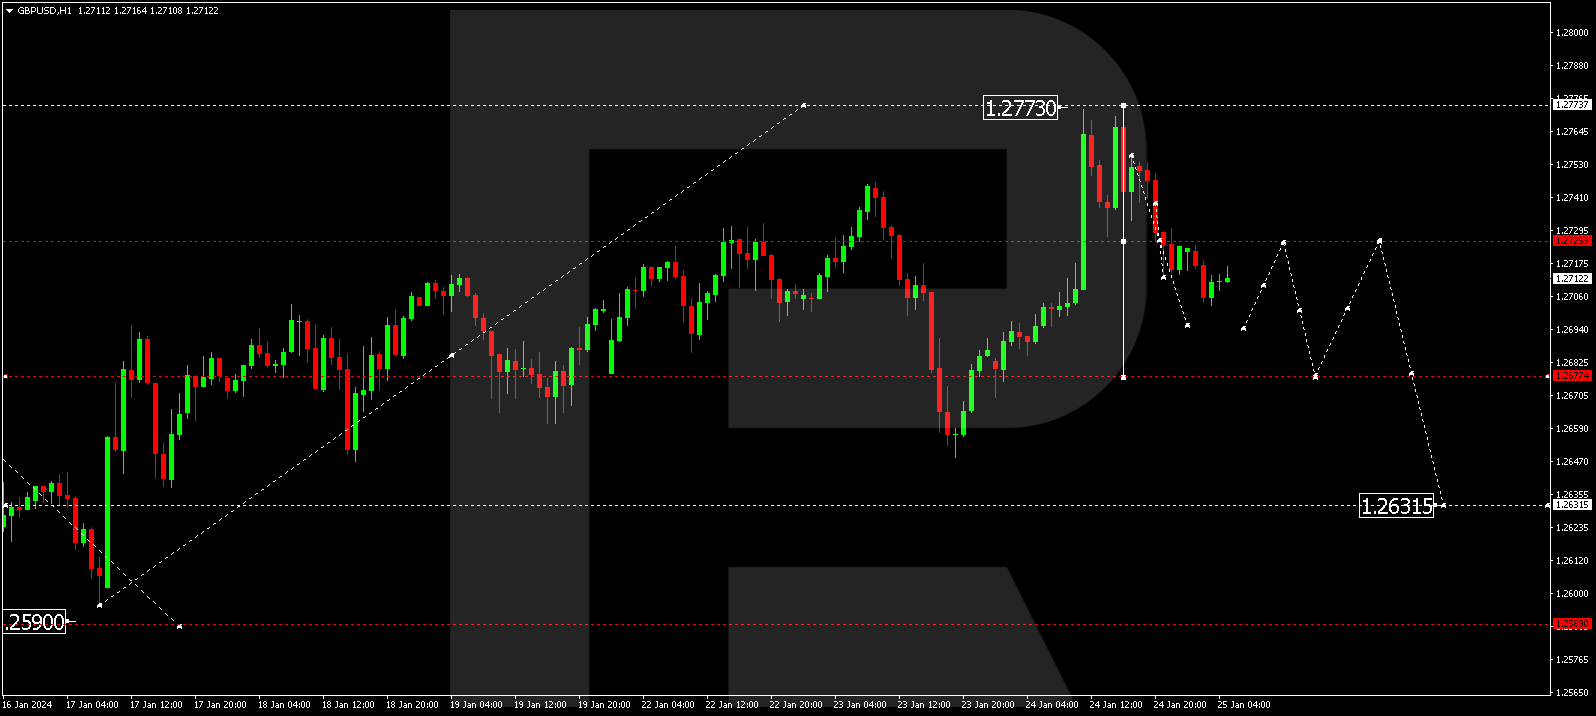
GBP/USD has shaped a correction wave to 1.2773, executed a decline impulse to 1.2733, and corrected to 1.2755 today. The second decline impulse to 1.2695 is in progress, potentially followed by a correction link to 1.2722 (tested from below). The wave might extend to 1.2675, constituting the first target.
USD/JPY (US Dollar vs Japanese Yen)
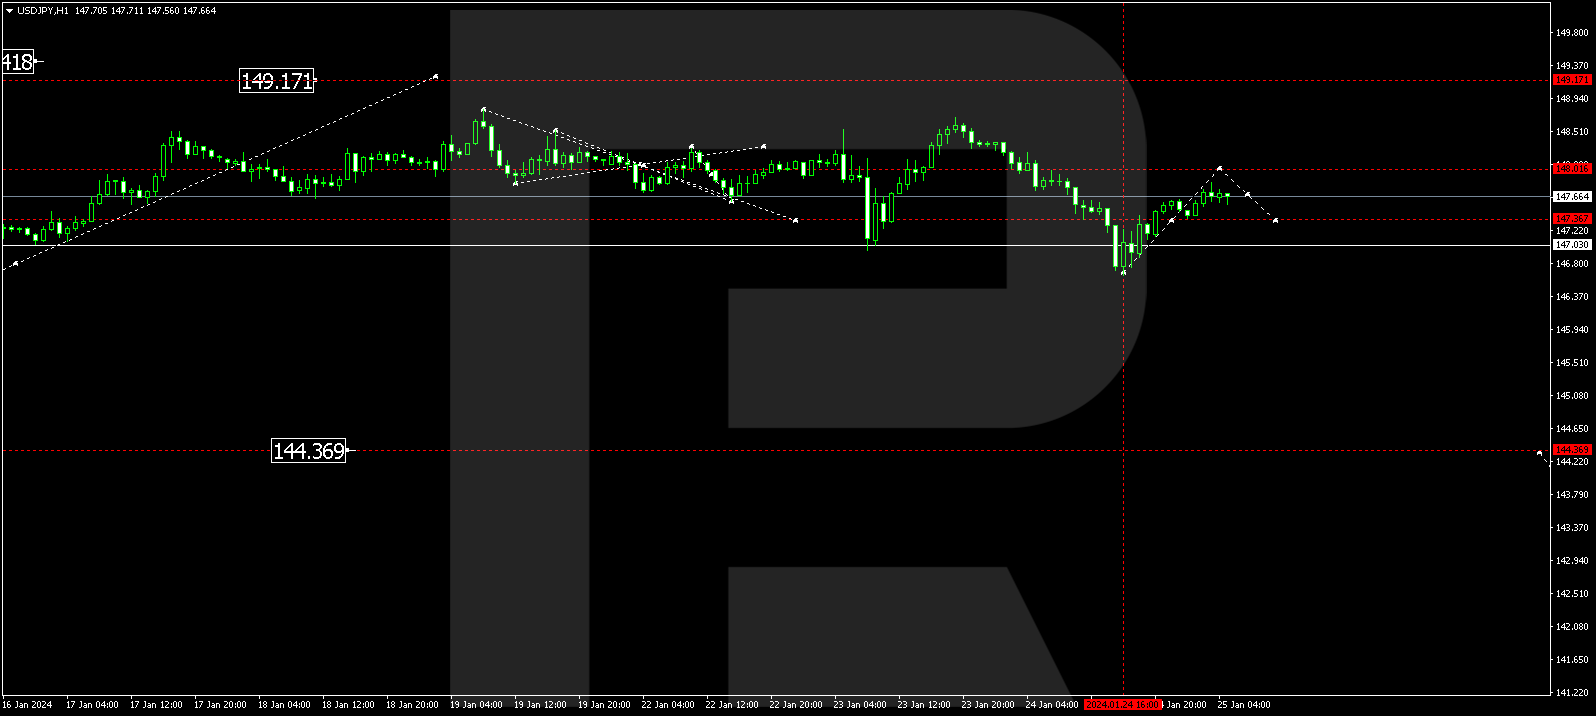
USD/JPY is forming a growth structure to 148.02. Upon reaching this level, a correction link to 147.40 is conceivable. Next, the pair could ascend to 149.17. This is the initial target.


USD/CHF (US Dollar vs Swiss Franc)
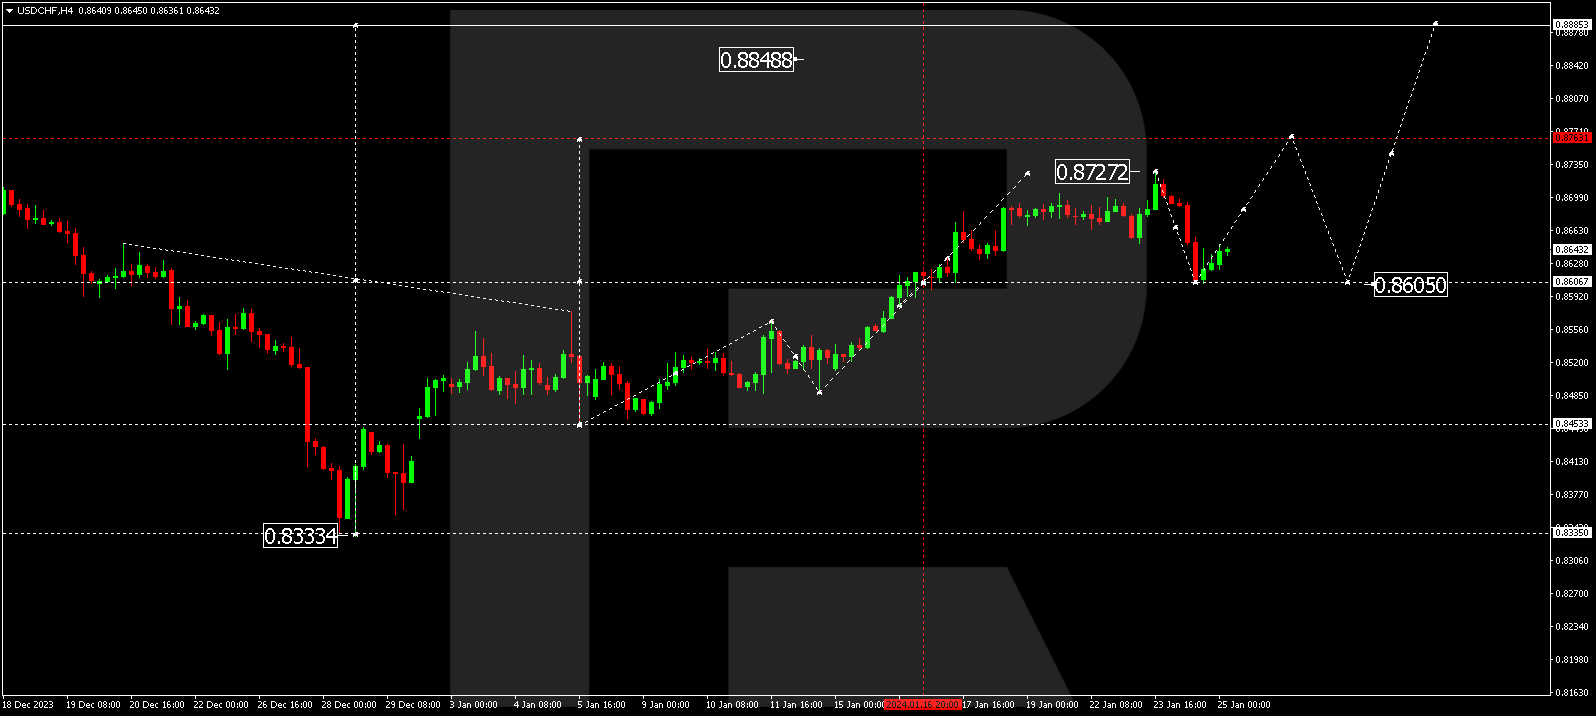
USD/CHF has concluded a correction wave to 0.8605. A growth wave to 0.8686 might unfold today. Breaking through this level could pave the way for a rise to 0.8727, from where the trend might extend to 0.8760.
AUD/USD (Australian Dollar vs US Dollar)
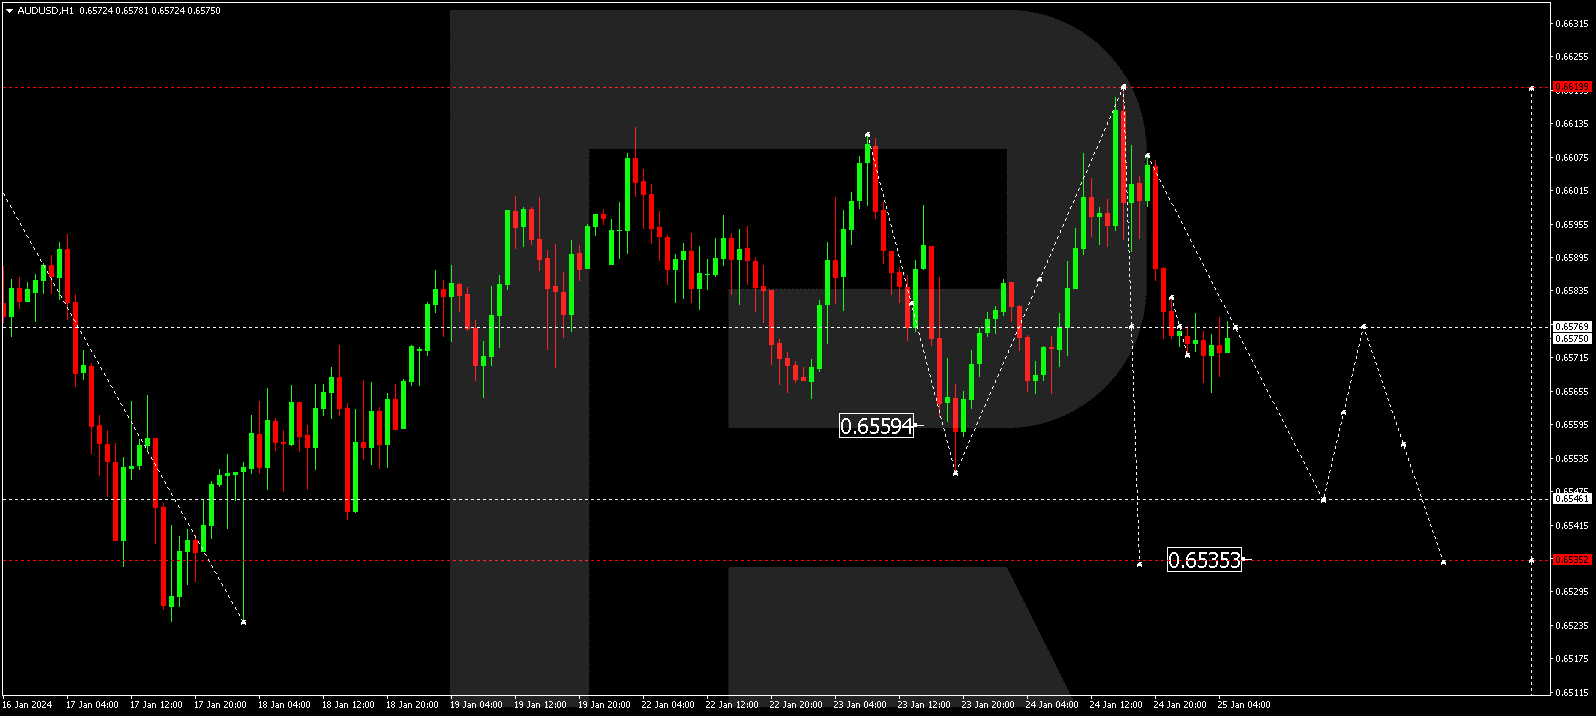
AUD/USD has undergone a decline wave to 0.6577, and a consolidation range around this level is taking shape today. An escape from the range downward, continuing the wave to 0.6546, is anticipated. This represents a local target. Upon reaching it, a correction link to 0.6577 is plausible (tested from below), followed by a decline to 0.6536, the first target.
BRENT
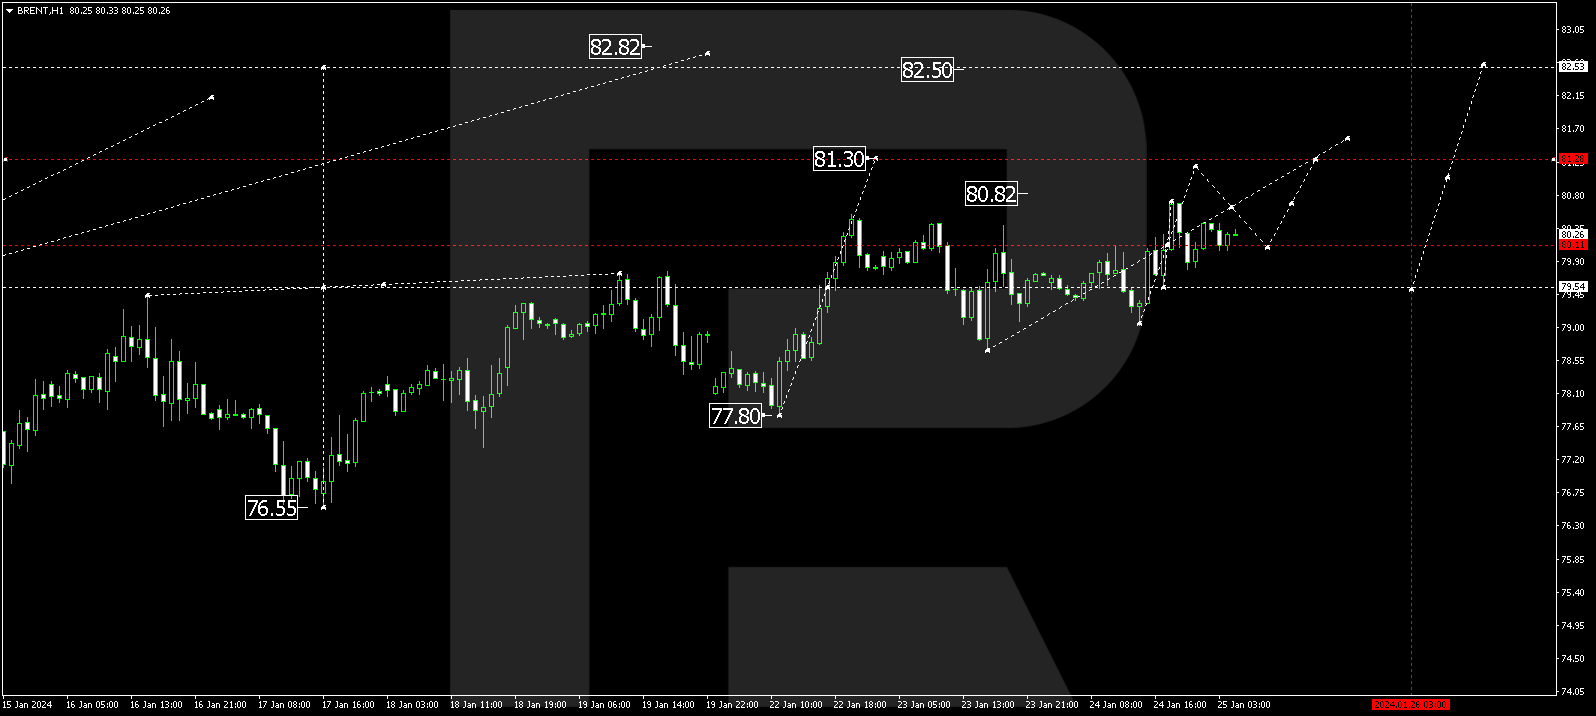
Brent has accomplished a growth structure to 80.72. Today, the market has corrected to 79.80. A consolidation range is forming above this level. An upward breakout and further wave development towards 81.20 are expected, from where the trend could extend to 82.55. This marks a local target.
XAU/USD (Gold vs US Dollar)
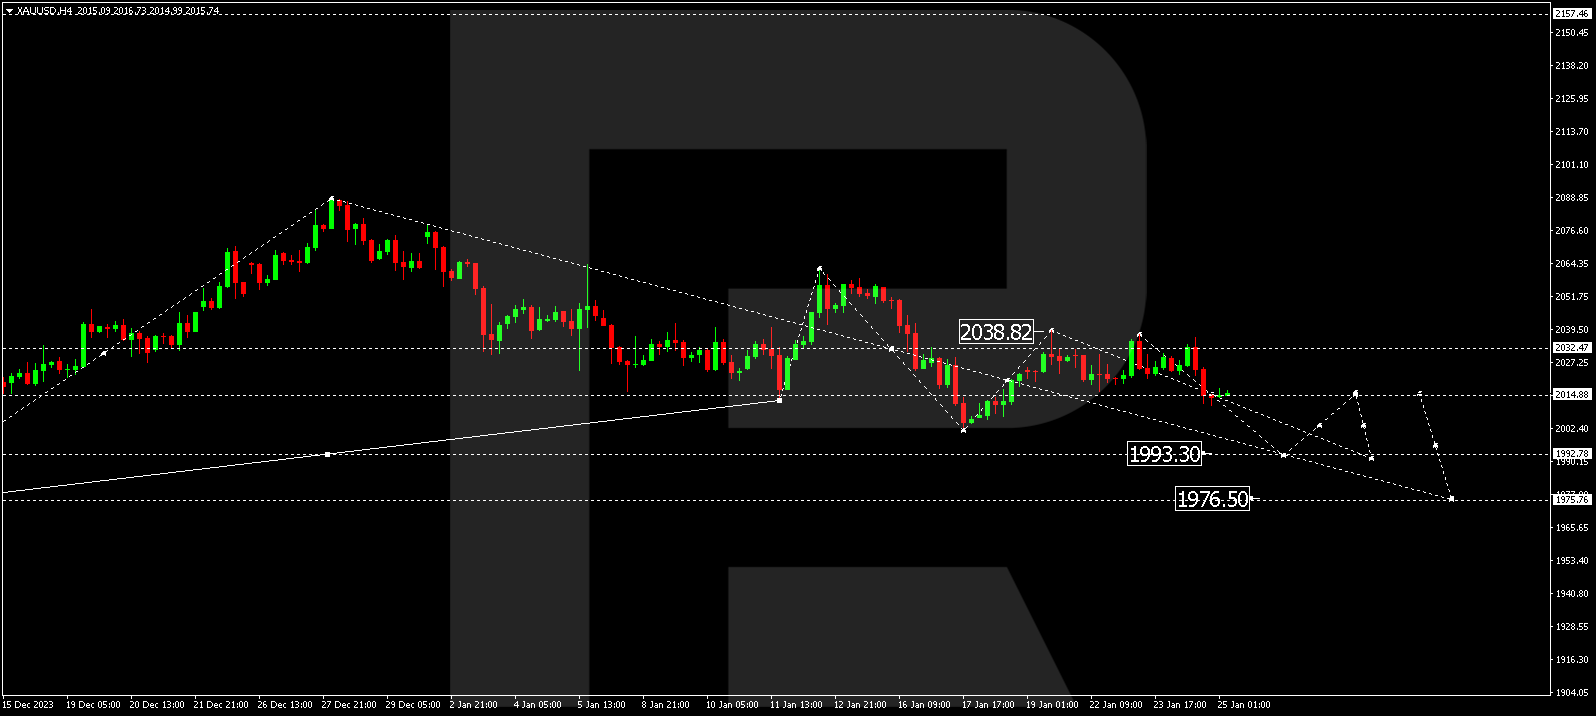
Gold has executed a decline wave to 2011.17. Currently, the market is forming a narrow consolidation range. A downward escape from the range could usher in a decline wave to 1993.30, followed by a correction to 2014.00 (tested from below). Subsequently, a decline to 1976.50 might manifest. This signifies a local target.
S&P 500
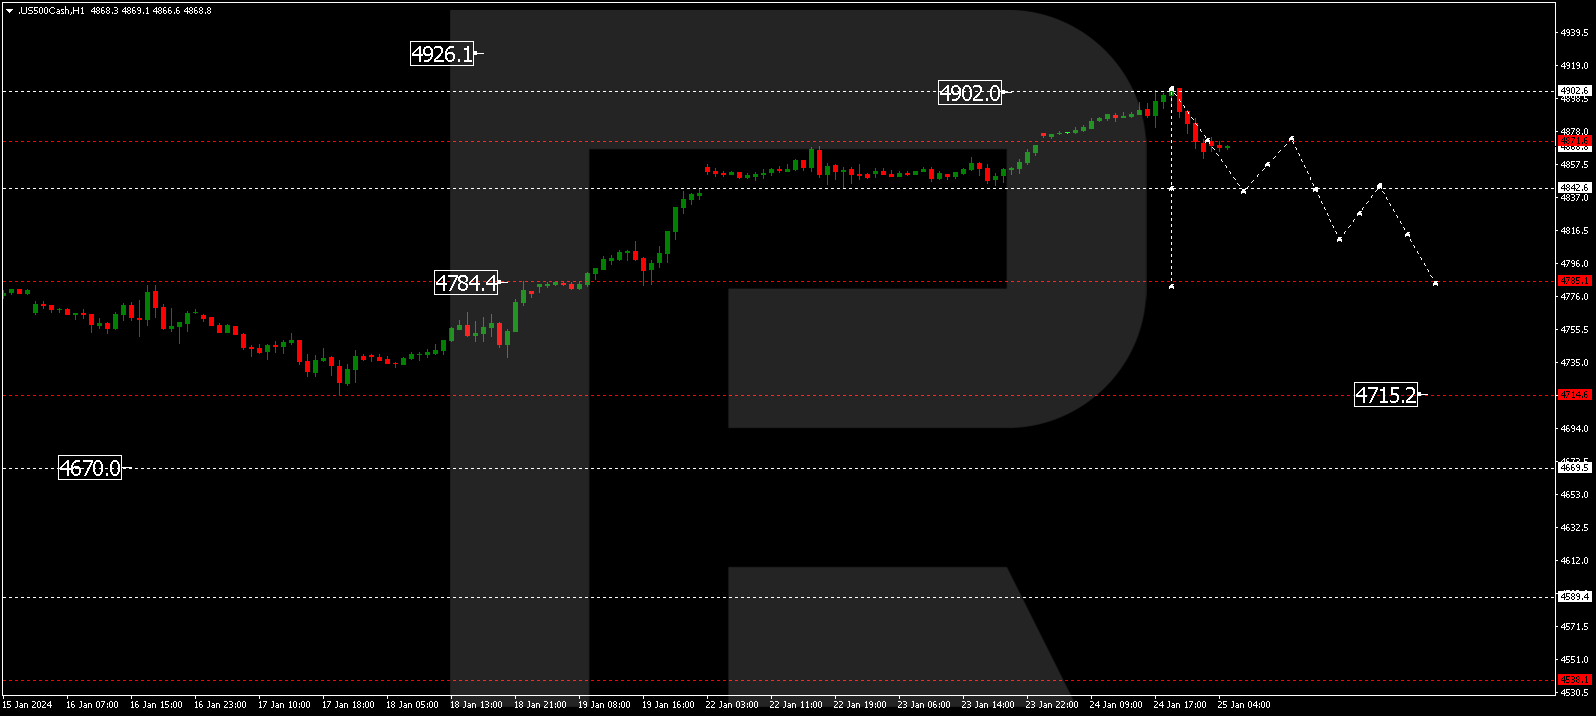
The stock index has completed a growth wave structure to 4902.0. Today, the market is forming a decline structure to 4842.5. Upon reaching this level, a correction to 4871.0 is unfolding. Subsequently, a decline to 4815.5 might follow. This constitutes a local target.
The post Technical Analysis & Forecast January 25, 2024 appeared first at R Blog – RoboForex.