
Brent’s Decline Continues. This analysis also encompasses the movements of EUR, GBP, JPY, CHF, AUD, Gold, and the S&P 500 index.
EUR/USD (Euro vs US Dollar)
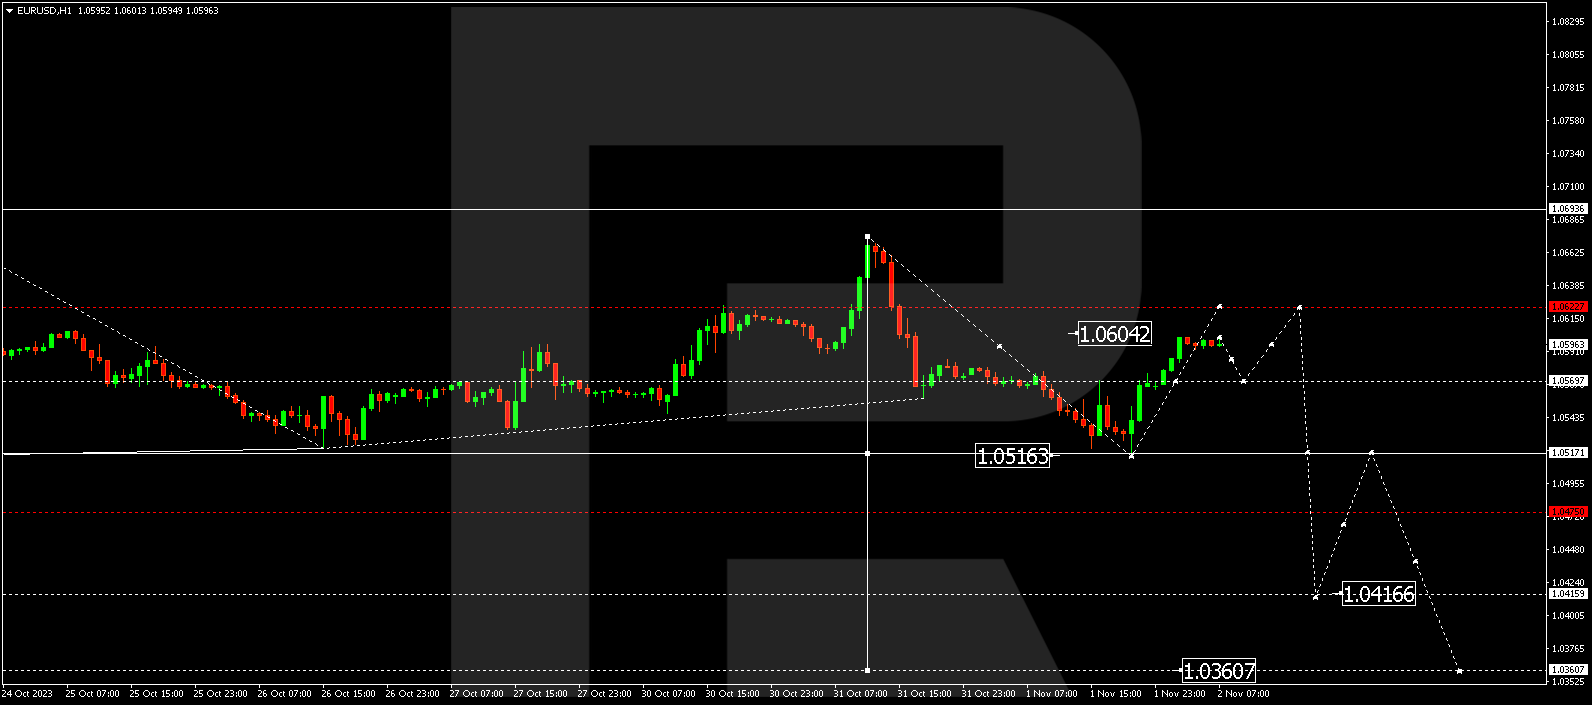
EUR/USD completed a downward wave to 1.0516. Subsequently, it initiated an upward impulse to 1.0565. Currently, a consolidation range has formed around this level. A breakout to the upside could extend the upward movement to 1.0616. Following this target, prices might regress to 1.0565.
GBP/USD (Great Britain Pound vs US Dollar)
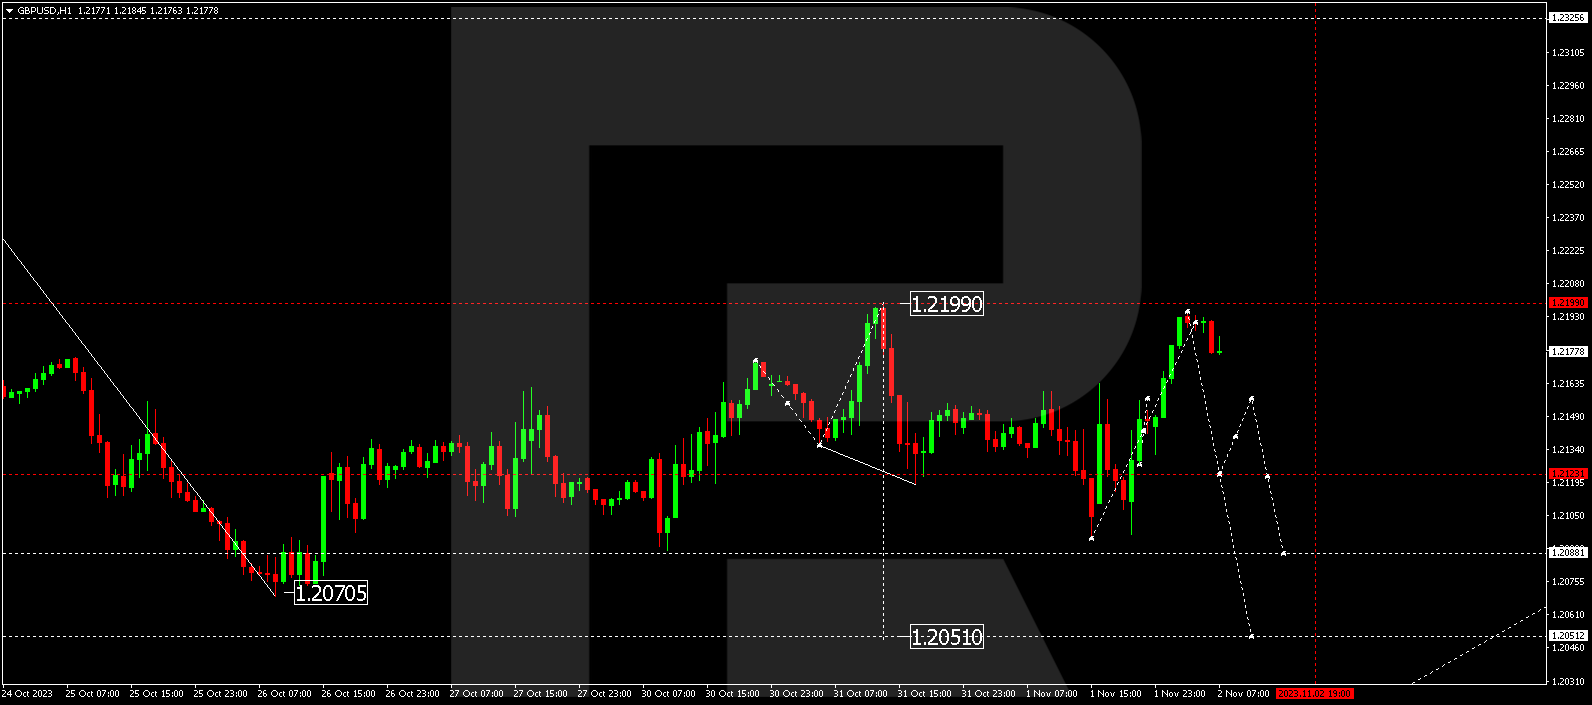
GBP/USD concluded a descending wave at 1.2095. Today, it displayed an upward impulse to 1.2195. The market is essentially establishing a broad consolidation range near the 1.2141 level. An upcoming downward move to 1.2141 is anticipated for today, possibly following a test from above. Another upward structure to 1.2200 is plausible after reaching this level. Post that, prices could instigate a new downward wave towards 1.2100.
USD/JPY (US Dollar vs Japanese Yen)
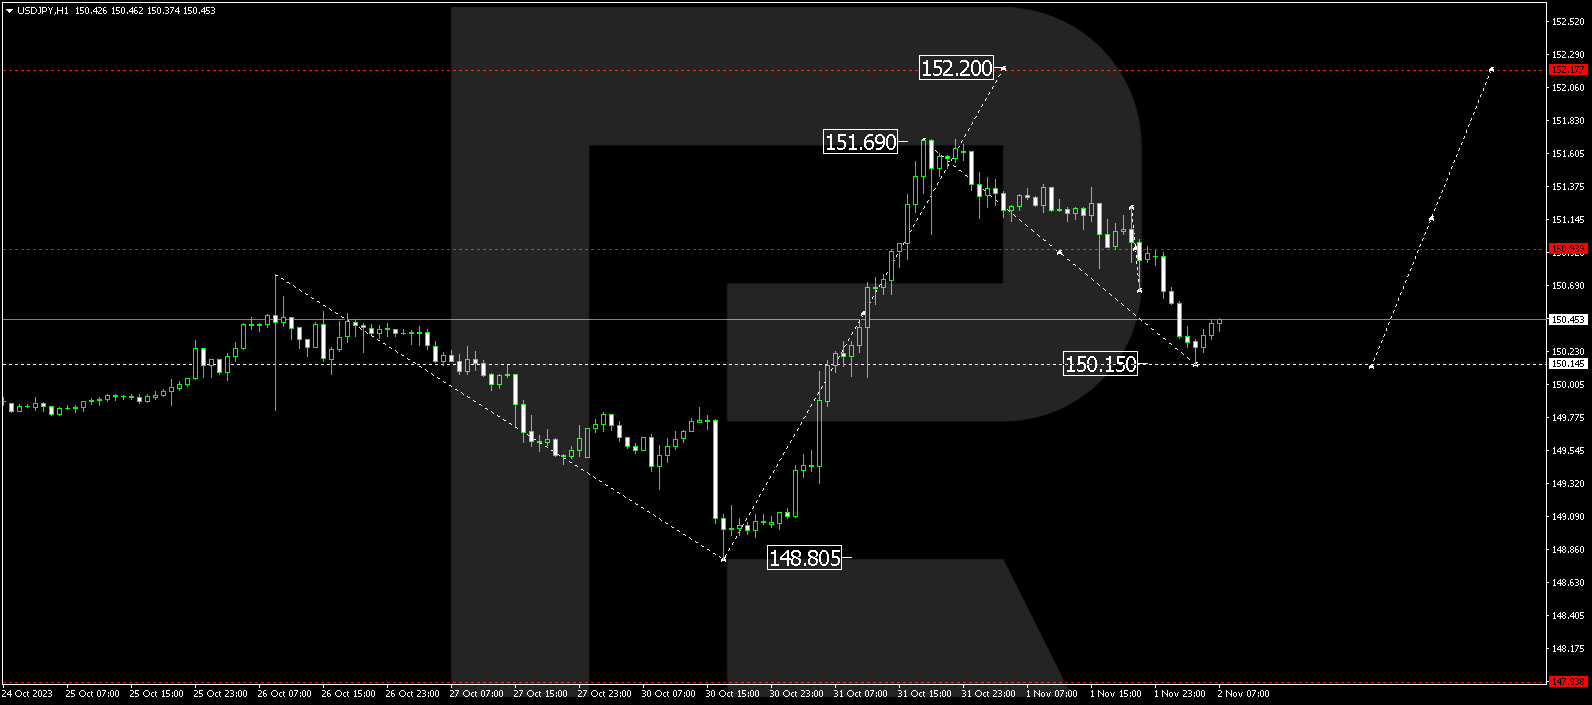
USD/JPY wrapped up a correction wave at 150.15. Today, it is consolidating above this level. An upward breakout could signify a fresh ascending wave to 152.20.


USD/CHF (US Dollar vs Swiss Franc)
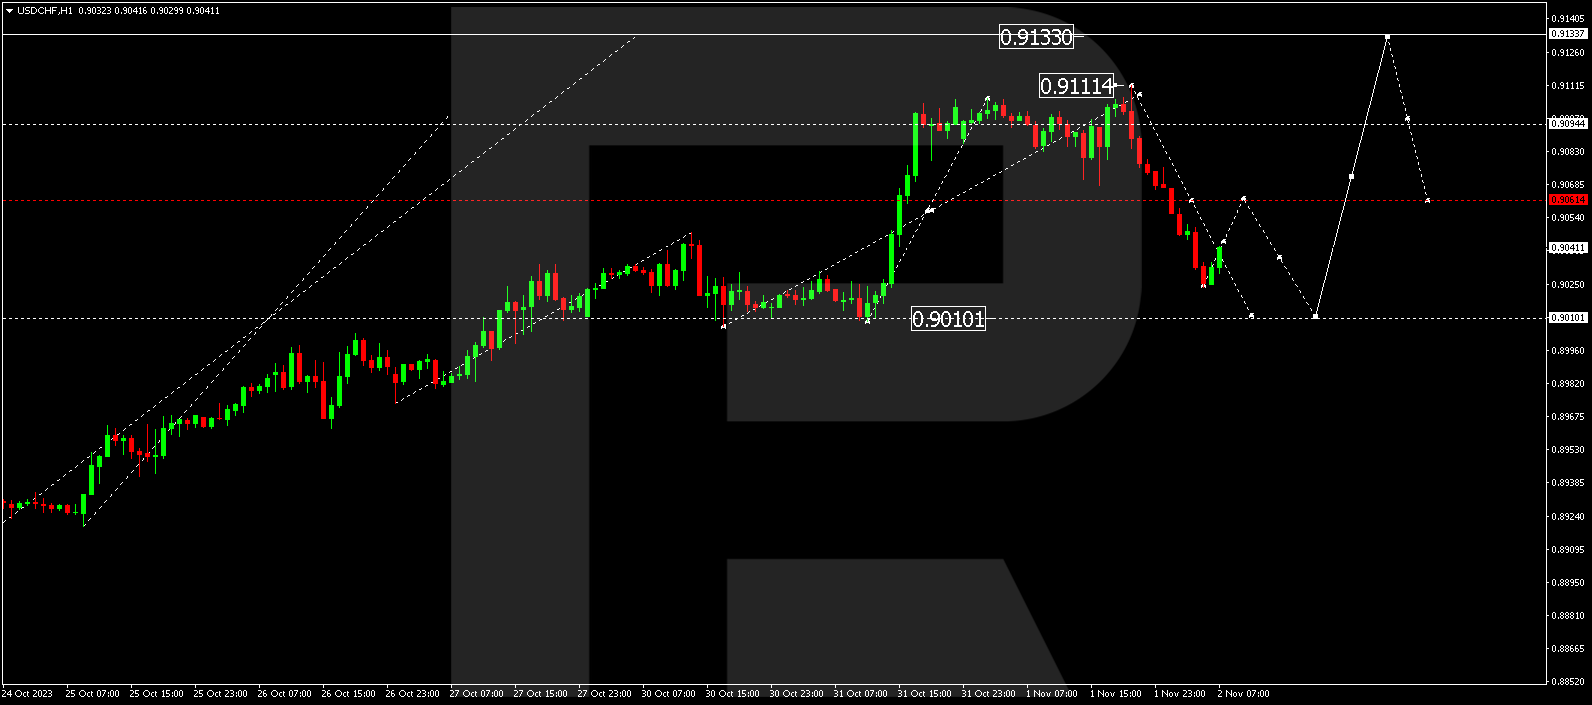
USD/CHF finalized a correction wave at 0.9024. A growth structure to 0.9064 might materialize today, followed by an expected downward link to 0.9010.
AUD/USD (Australian Dollar vs US Dollar)
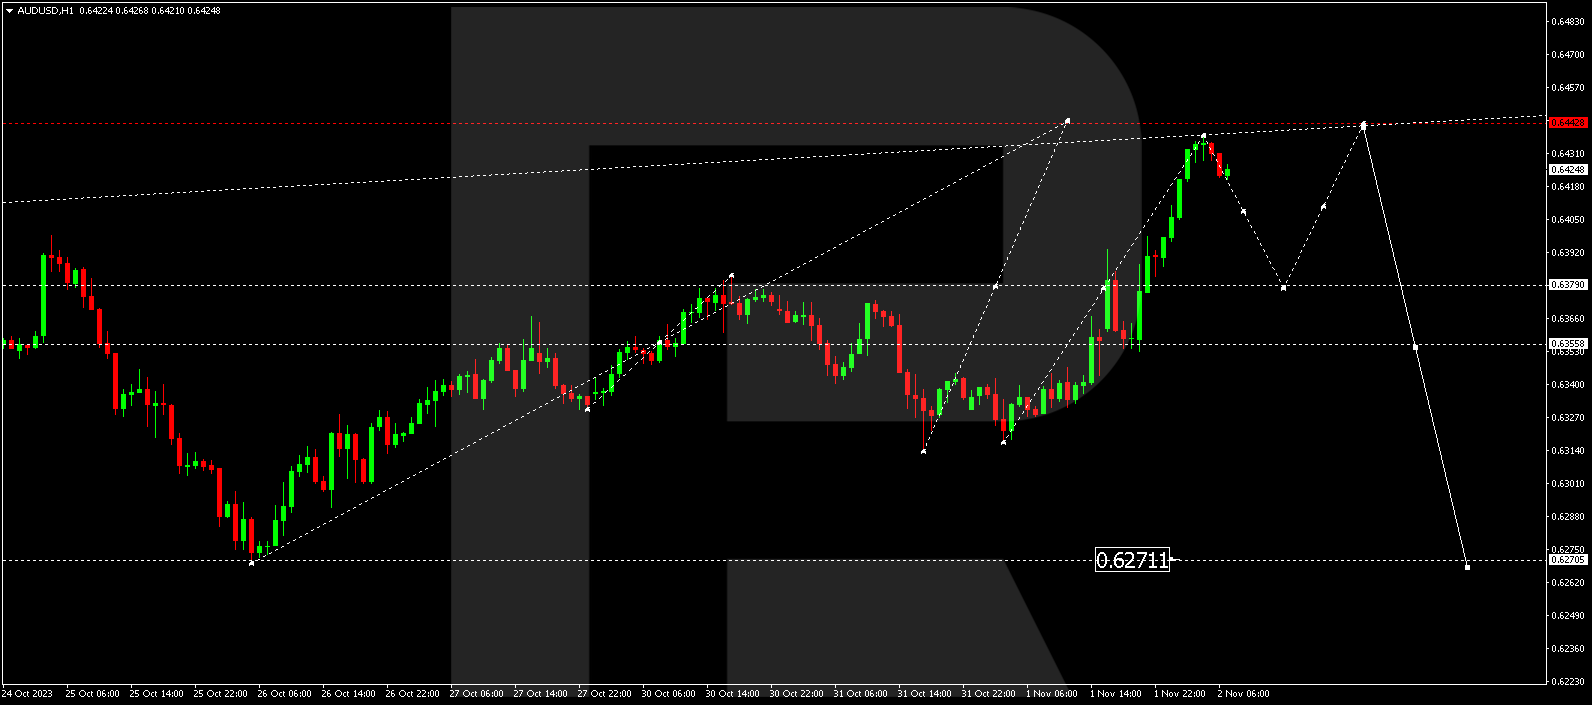
AUD/USD formed a consolidation range around 0.6355 and completed the wave at 0.6430 with an upward breakout. A decline to 0.6375 might transpire today, followed by a new upward structure to 0.6444.
BRENT
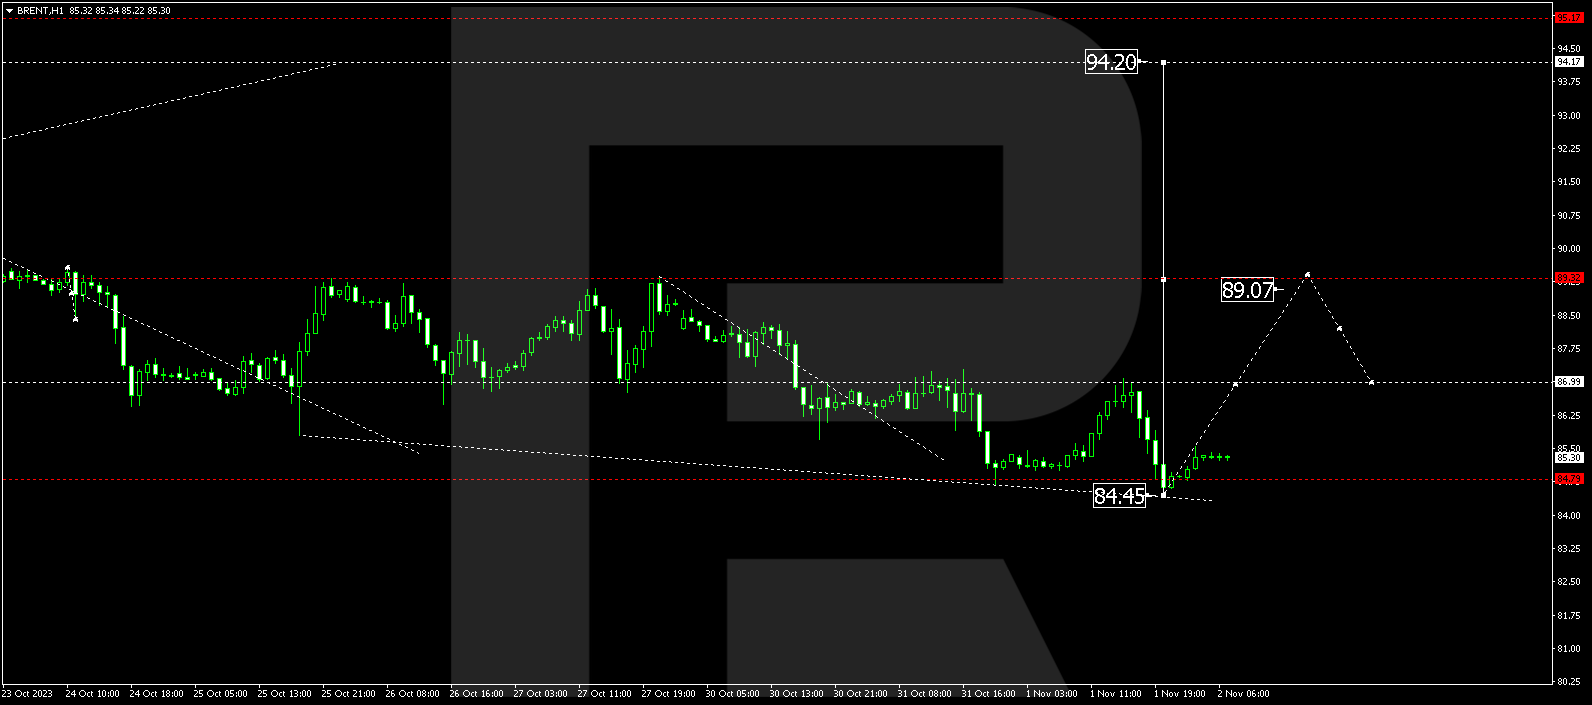
Brent rounded off an upward wave at 87.07. Today, the market introduced a declining structure to 84.45. Currently, a consolidation range is shaping up above this level. A breakout to the upside might initiate an upward wave to 89.33. In the event of a downward breakout, it could pave the way for an extended correction to 81.50.
XAU/USD (Gold vs US Dollar)
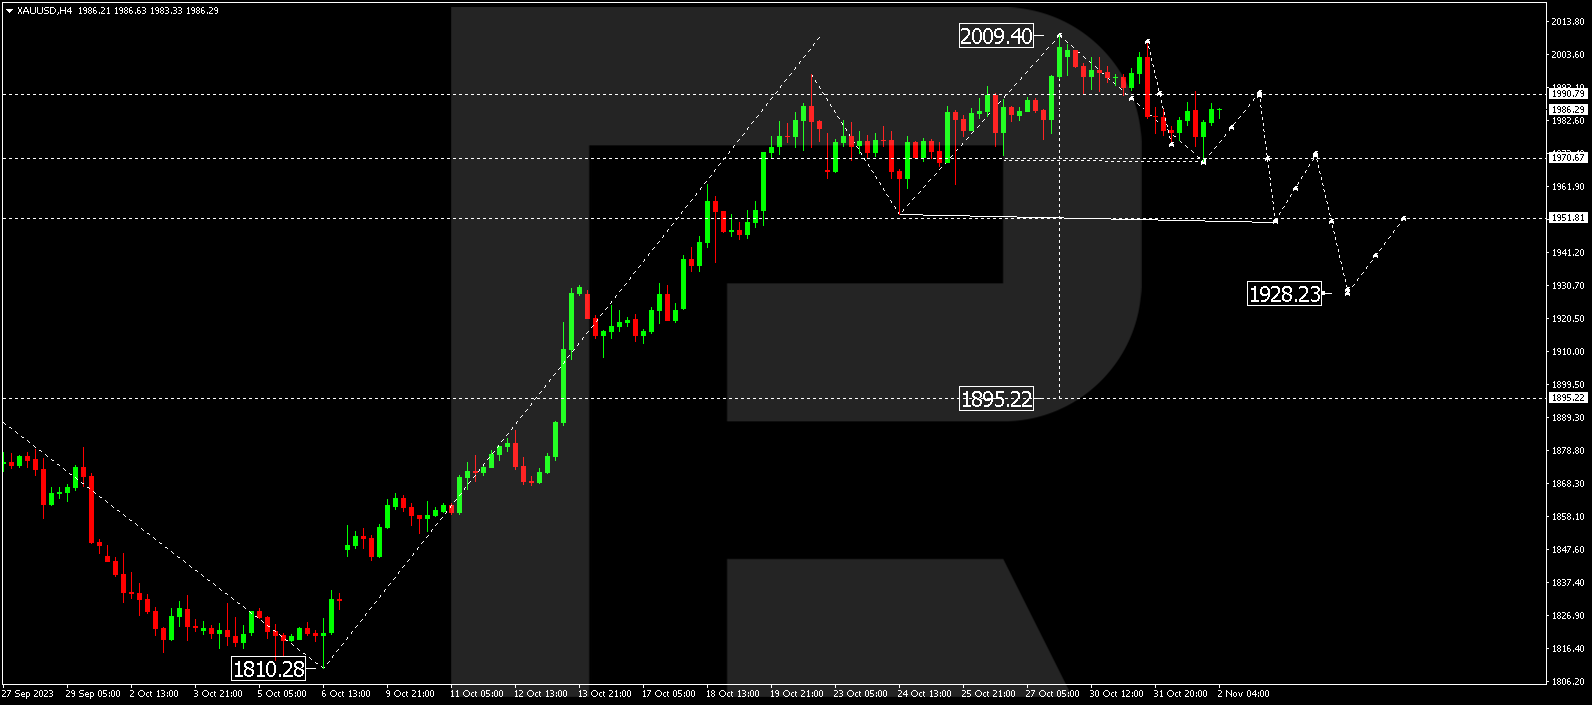
Gold reached the culmination of a declining wave at 1970.60. A correction to 1990.70 may be forthcoming. Afterward, a new descending wave to 1928.22 could commence. This constitutes a local target.
S&P 500
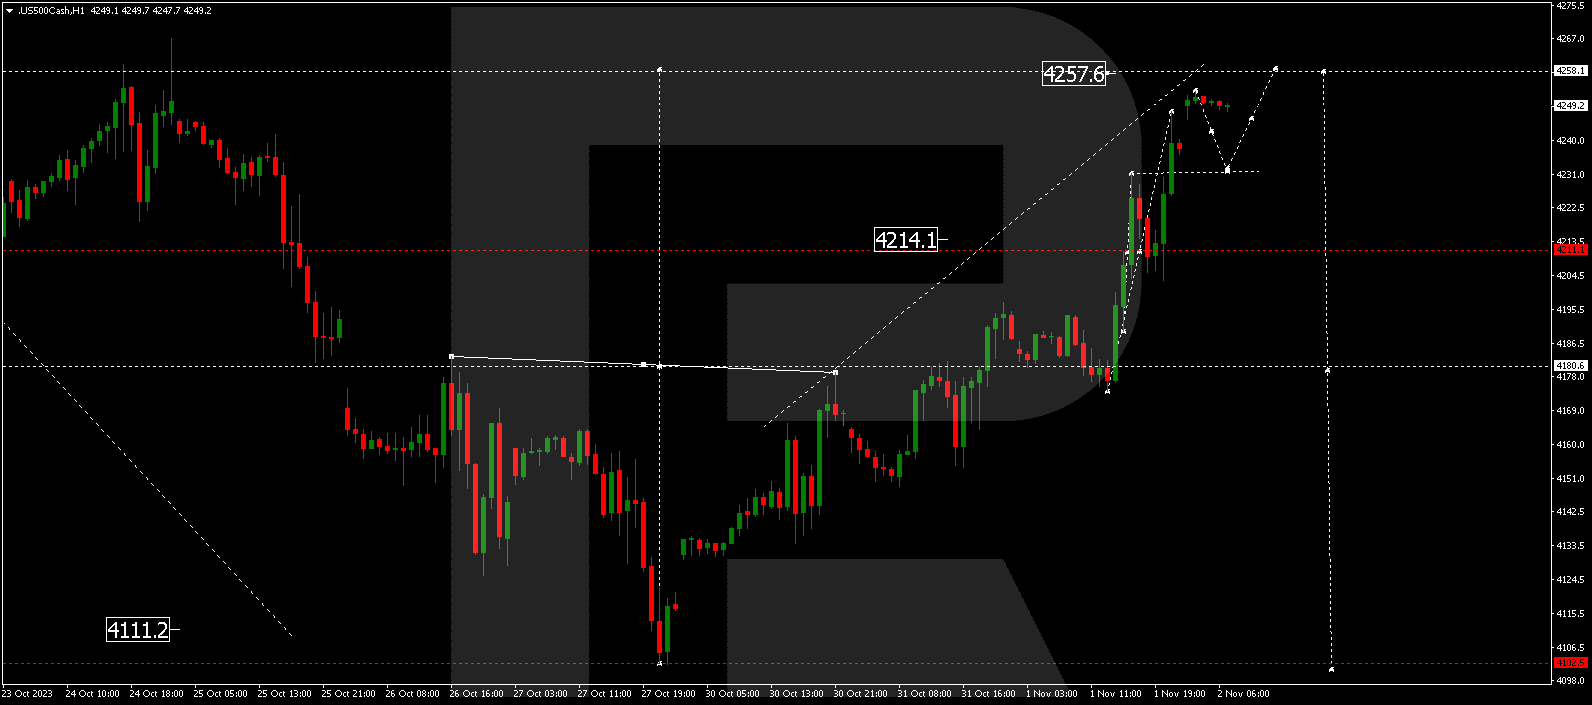
The stock index concluded an upward wave at 4252.0. A consolidation range might emerge today around this level, possibly extending to 4258.0. Subsequently, a correction to 4180.0 might kick off.
The post Technical Analysis & Forecast November 02, 2023 appeared first at R Blog – RoboForex.