
Brent Continues its Upward Momentum. This overview also delves into the dynamics of EUR, GBP, JPY, CHF, AUD, Gold, and the S&P 500 index.
EUR/USD (Euro vs US Dollar)
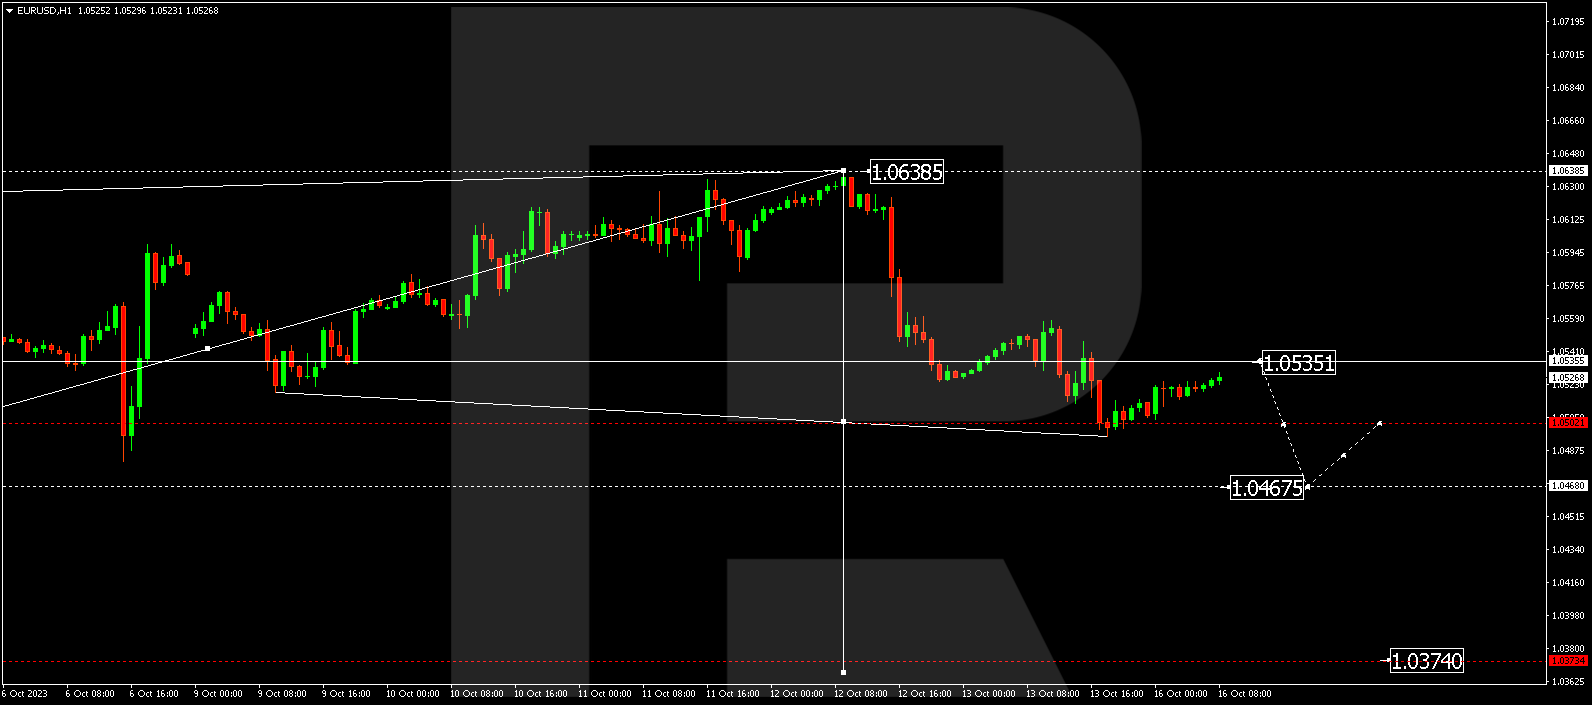
EUR/USD has concluded a downward wave, reaching 1.0500. A corrective bounce to 1.0535 is anticipated for today (with a test from below). Following this level, prices could decline to 1.0467. If this level is breached, the trend might persist towards 1.0374.
GBP/USD (Great Britain Pound vs US Dollar)
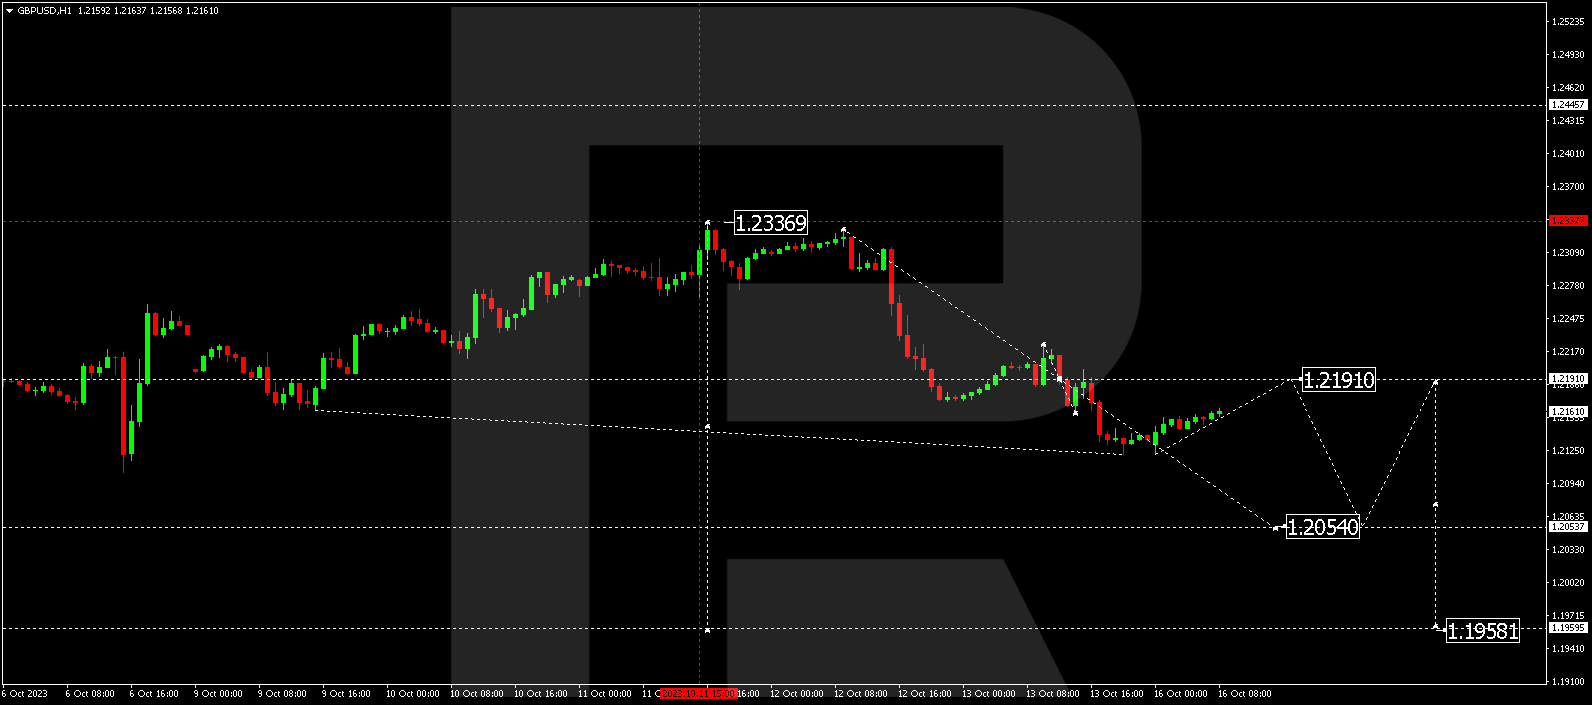
GBP/USD has finished a descending wave at 1.2122. Today, prices could correct to 1.2191 (with a test from below). Subsequently, the downward wave might extend to 1.2054, after which the trend could continue to 1.1959.
USD/JPY (US Dollar vs Japanese Yen)
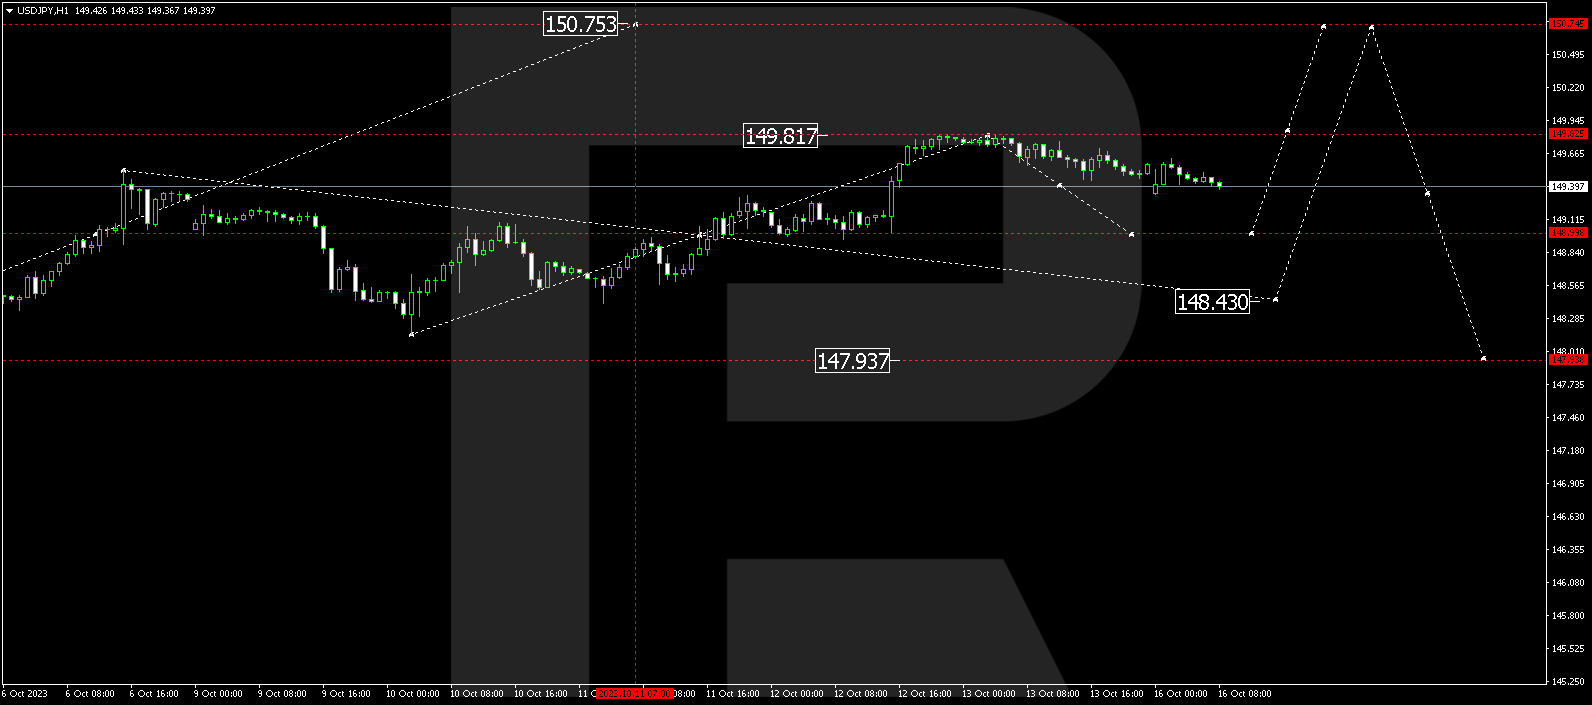
USD/JPY is currently consolidating around 149.49. A downward breakout from this range could potentially lead to a correction to 148.98. Conversely, an upward breakout could initiate a rising wave to 150.75.


USD/CHF (US Dollar vs Swiss Franc)
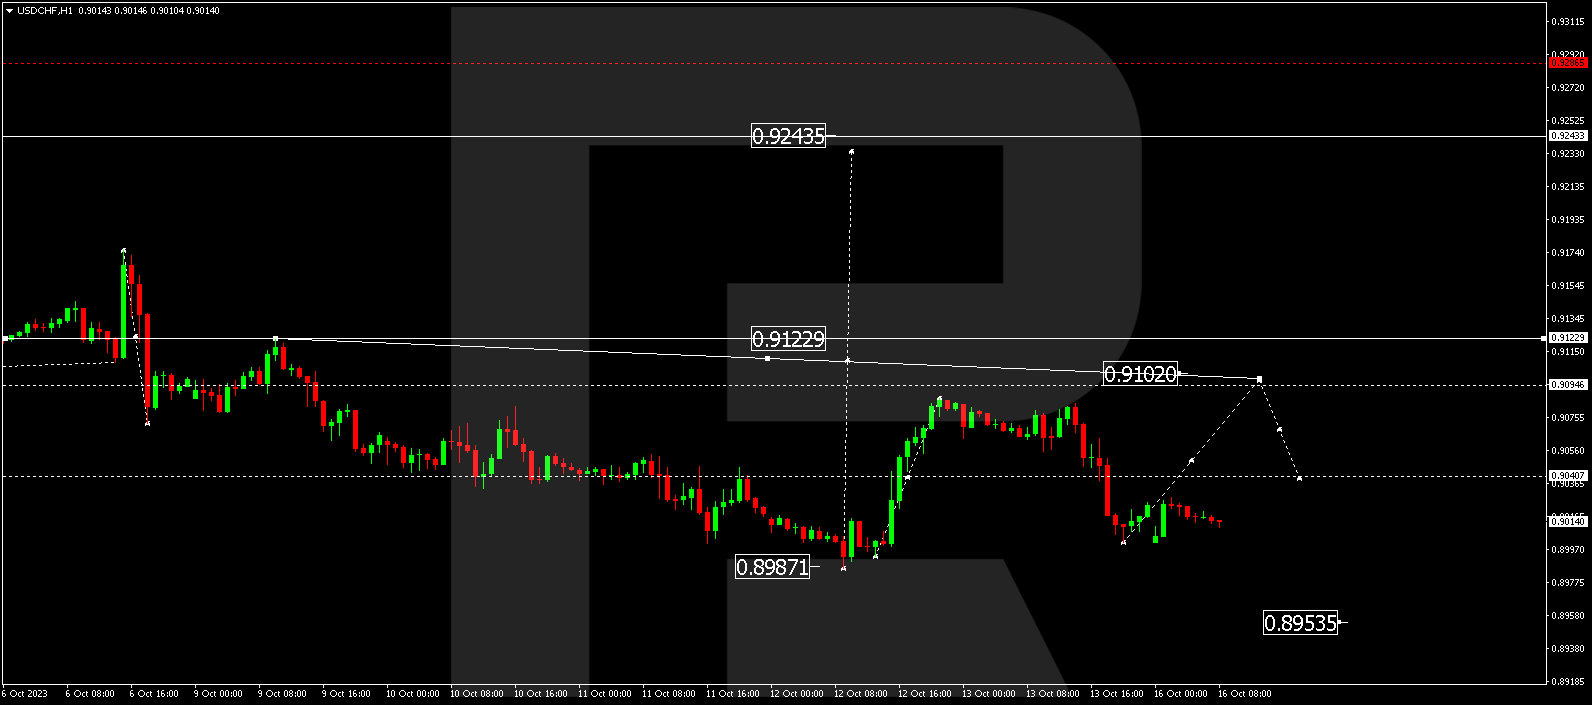
USD/CHF has wrapped up a decline, reaching 0.9000. The market is currently forming a consolidation range above this level. A breakout from this range towards the upside might trigger a rising phase to 0.9102. Following this, a correction to 0.9040 is likely.
AUD/USD (Australian Dollar vs US Dollar)
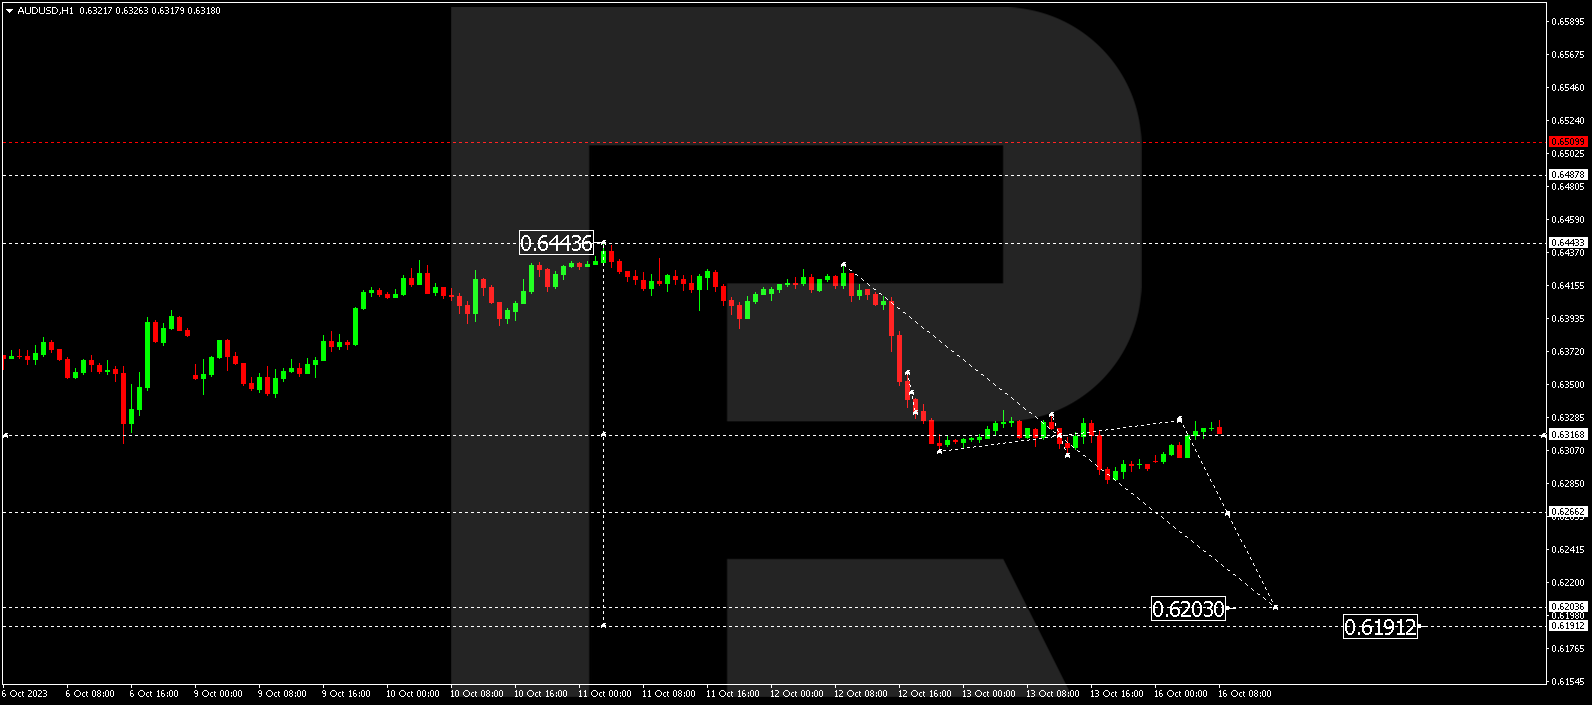
AUD/USD has completed a declining wave to 0.6285. A correction to 0.6345 is anticipated today (with a test from below). Subsequently, the declining wave might extend to 0.6203, and from there, the trend could continue to 0.6191.
BRENT
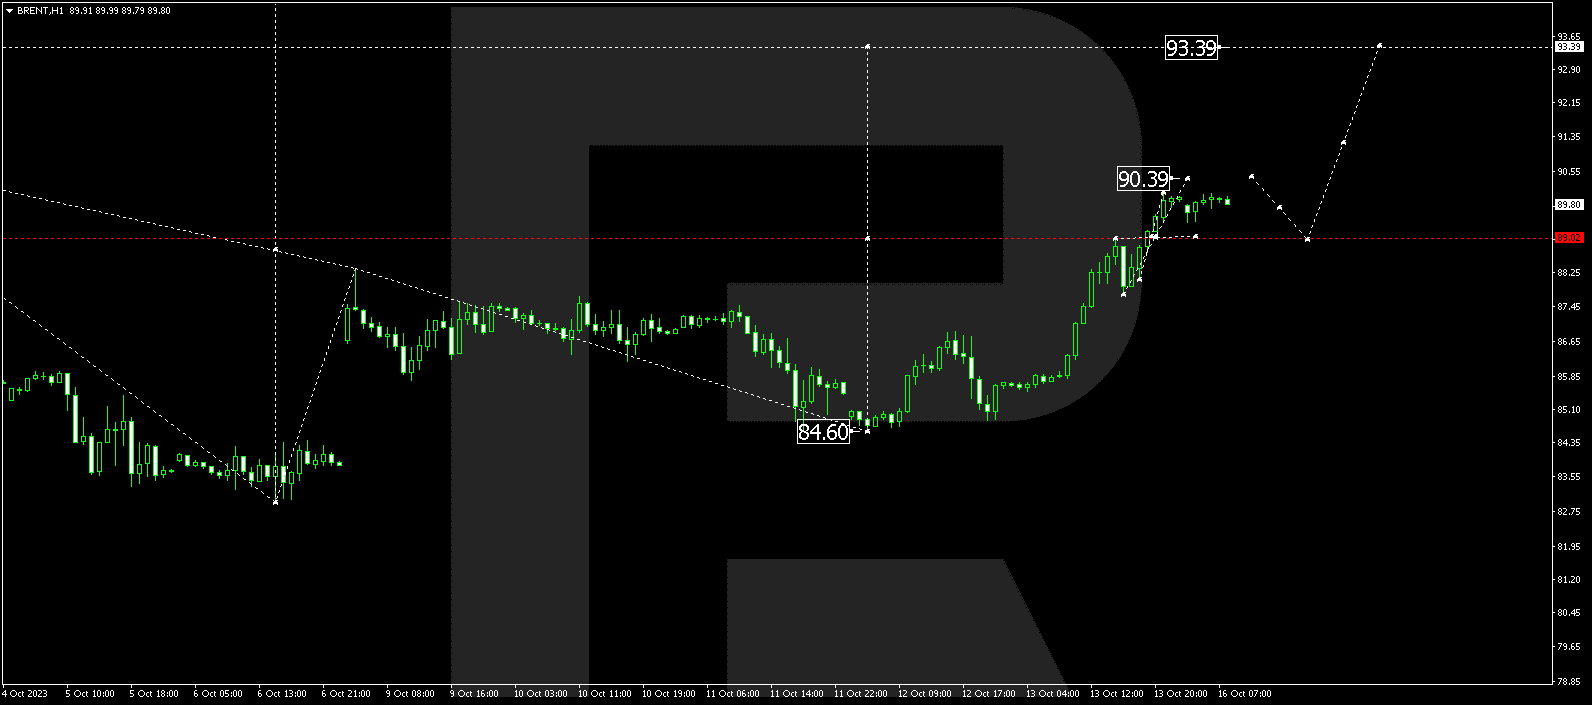
Brent has concluded an upward wave, reaching 90.00. A consolidation range is taking shape beneath this level today. In the event of a downward breakout, a corrective decline to 89.00 is plausible. However, an upward breakout could propel a rising wave to 93.39. This is the immediate target.
XAU/USD (Gold vs US Dollar)
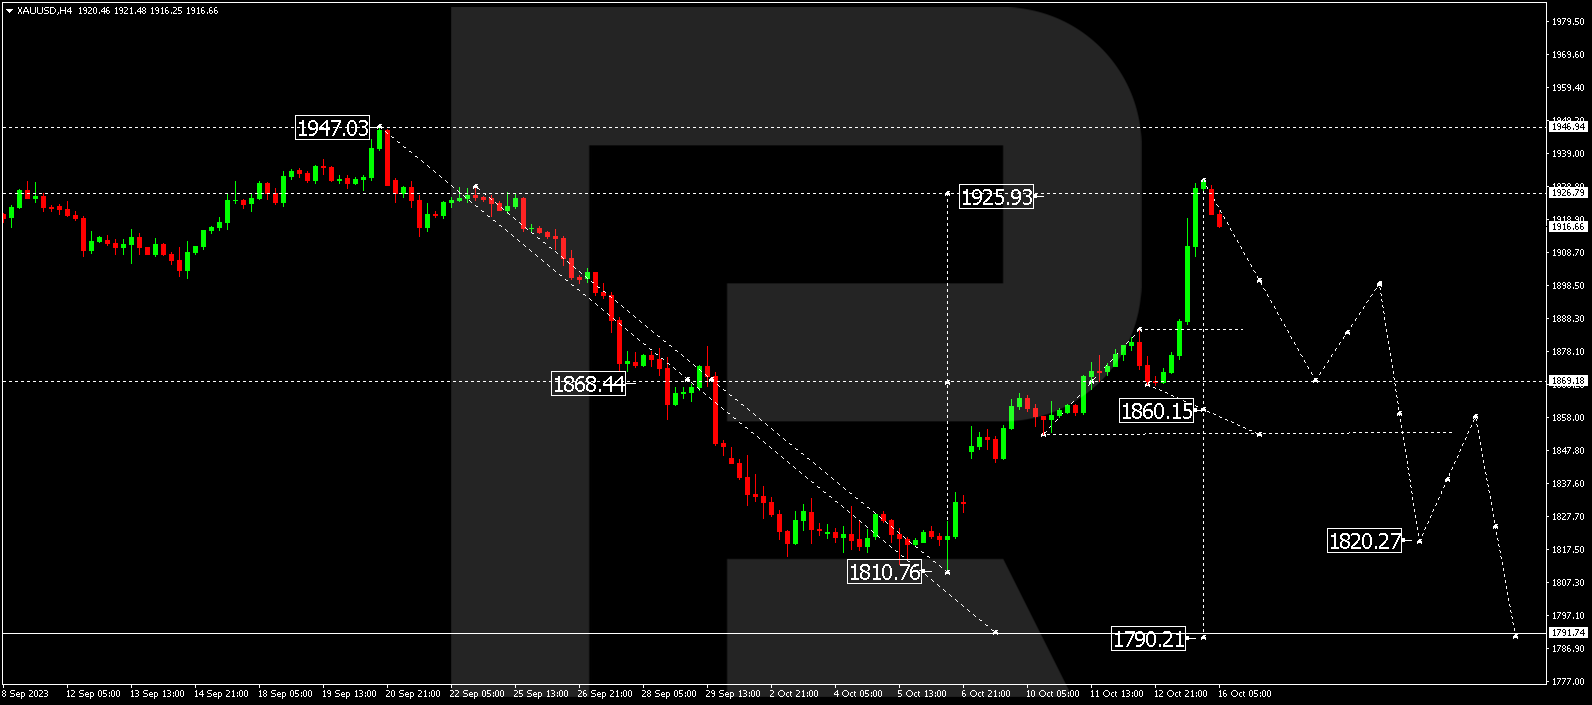
Gold has established a consolidation range around 1869.20 and completed an upward wave to 1926.00 by breaking out of this range. A correction to 1855.00 might transpire today. Next, an upward link to 1888.00, followed by a decline to 1820.22, is expected. This is a local target.
S&P 500
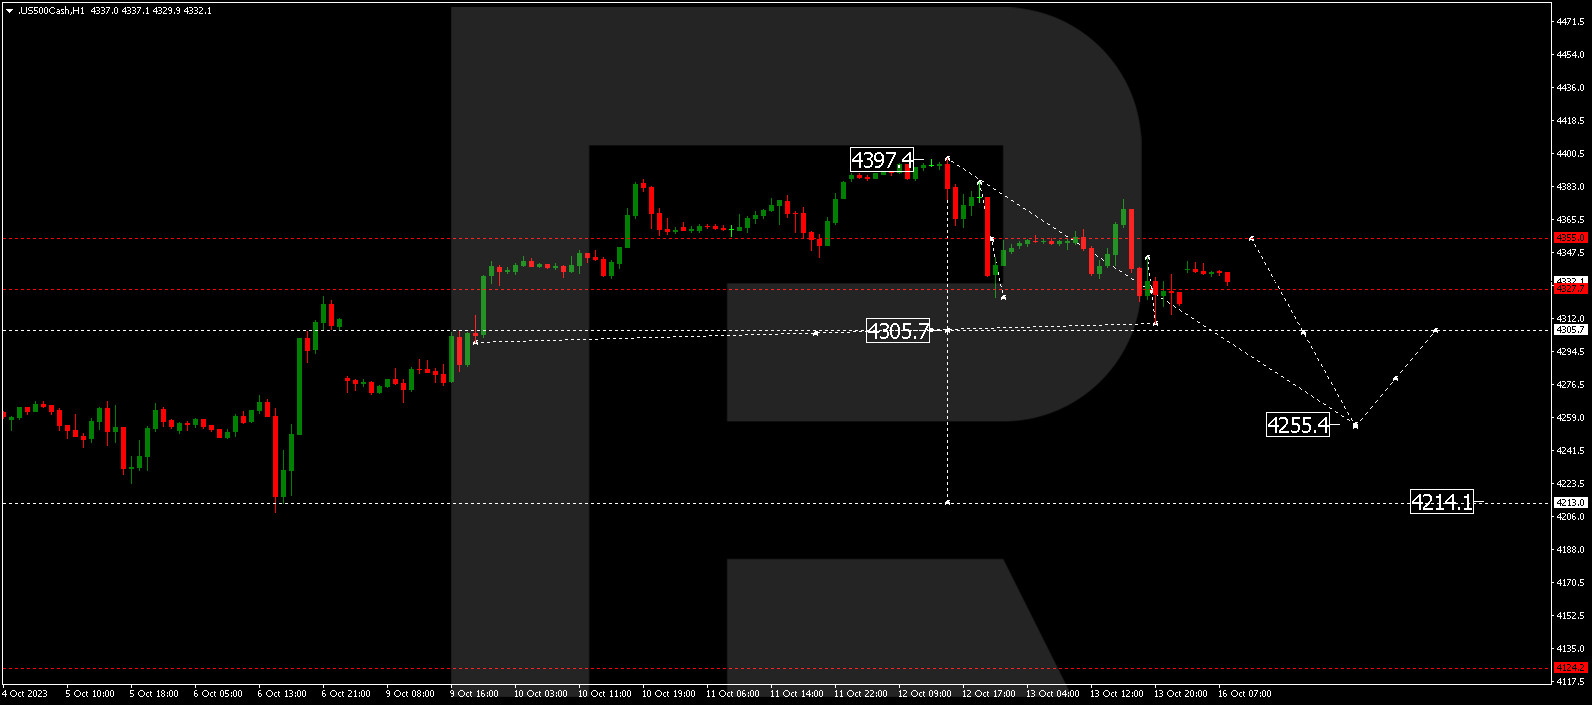
The stock index has wrapped up a declining wave at 4311.0. Subsequently, a correction to 4355.0 could follow. Once this phase concludes, a new declining wave to 4255.5 might take shape. This represents the immediate target.
The post Technical Analysis & Forecast October 16, 2023 appeared first at R Blog – RoboForex.