
GBP in a Downtrend. In this analysis, we’ll also explore the dynamics of EUR, JPY, CHF, AUD, Brent, Gold, and the S&P 500 index.
EUR/USD (Euro vs US Dollar)
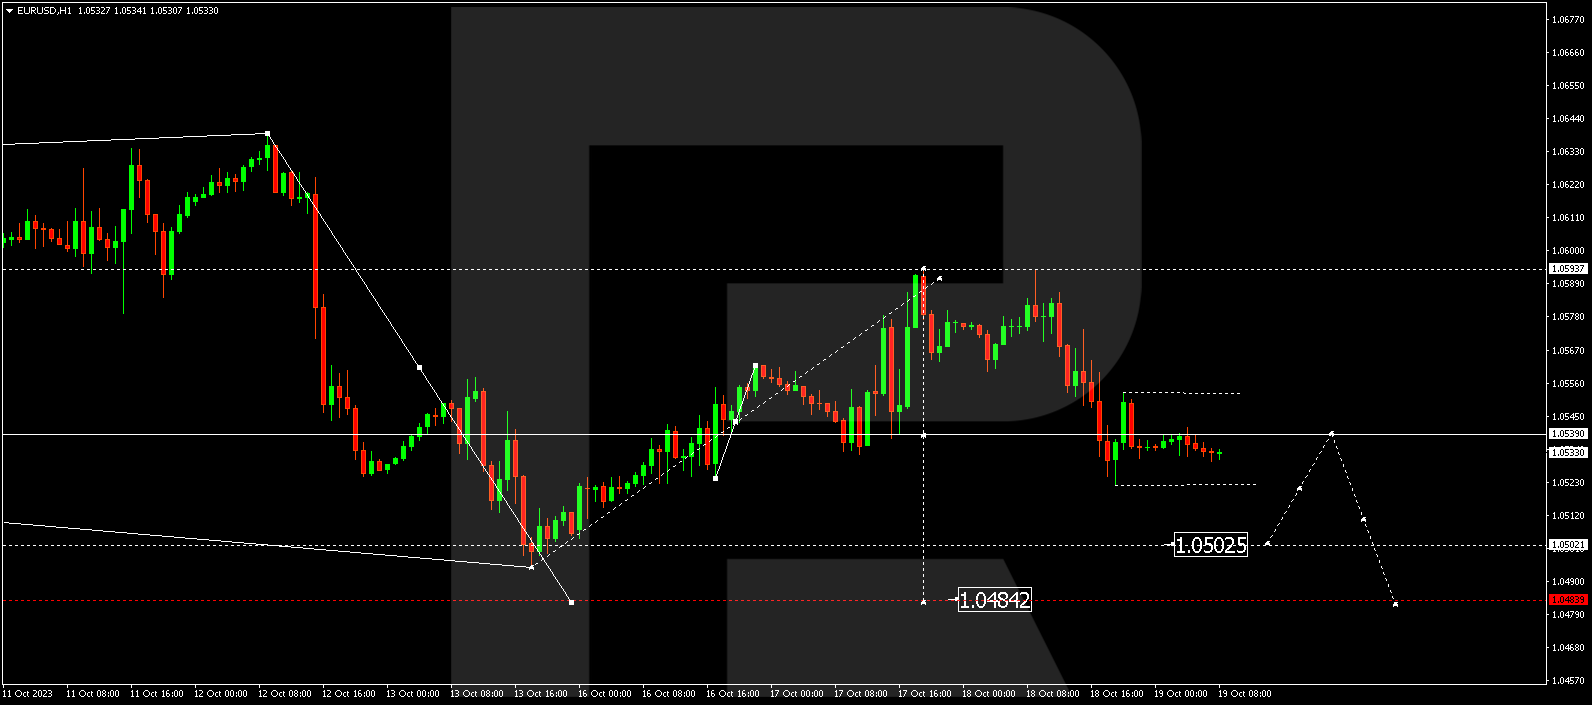
EUR/USD has bounced back from 1.0593, initiating a descent to 1.0522. Presently, a consolidation range is forming above this level. Should the quotes break free from this range, a target of 1.0502 becomes likely. Subsequently, a corrective bounce to 1.0540 (with a test from below) and a decline to 1.0484 may occur.
GBP/USD (Great Britain Pound vs US Dollar)
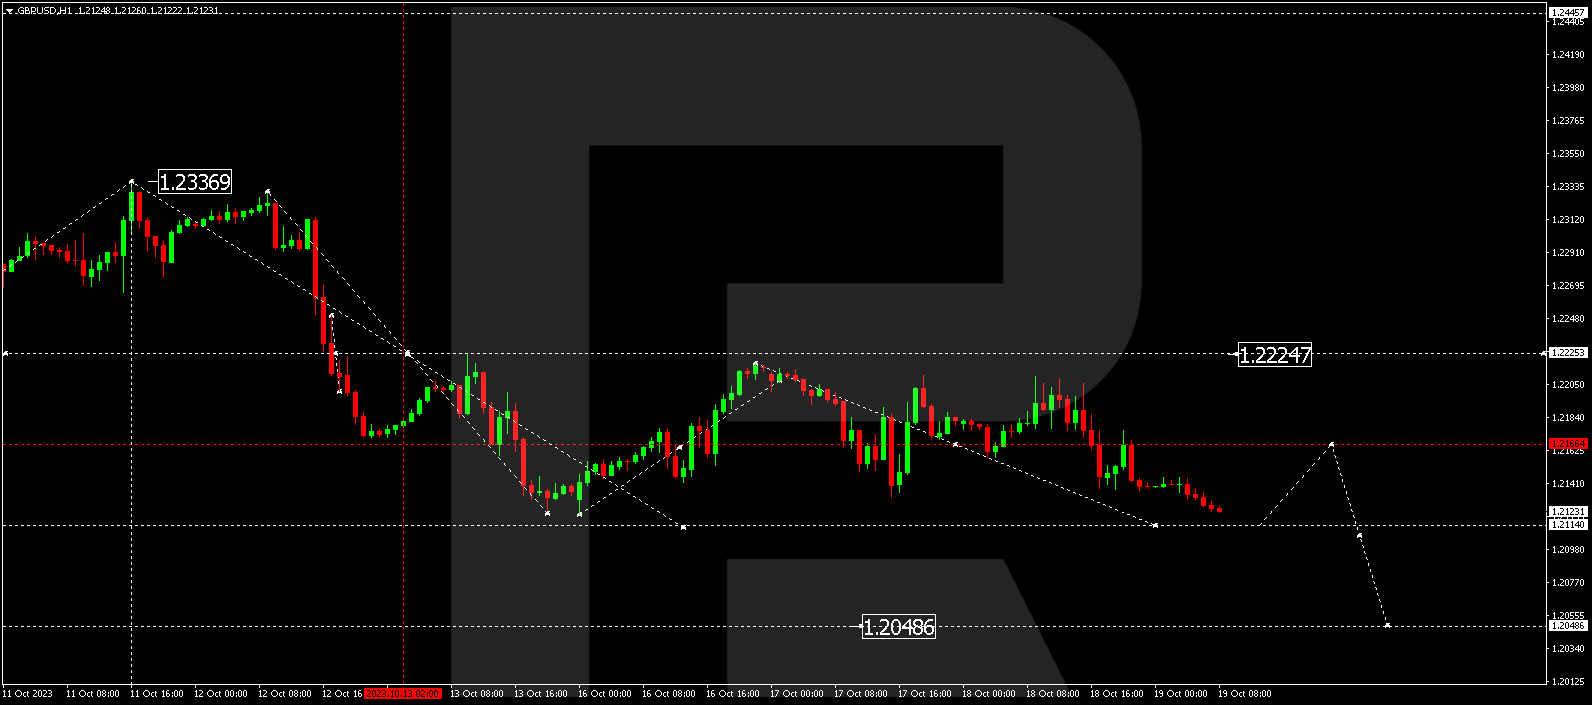
GBP/USD has rebounded from 1.2202 and is continuing its downward trajectory to 1.2112. Upon reaching this level, we might see some consolidation. If the pair reverses course and rises, a correction to 1.2166 (with a test from below) and a decline to 1.2048 could ensue.
USD/JPY (US Dollar vs Japanese Yen)
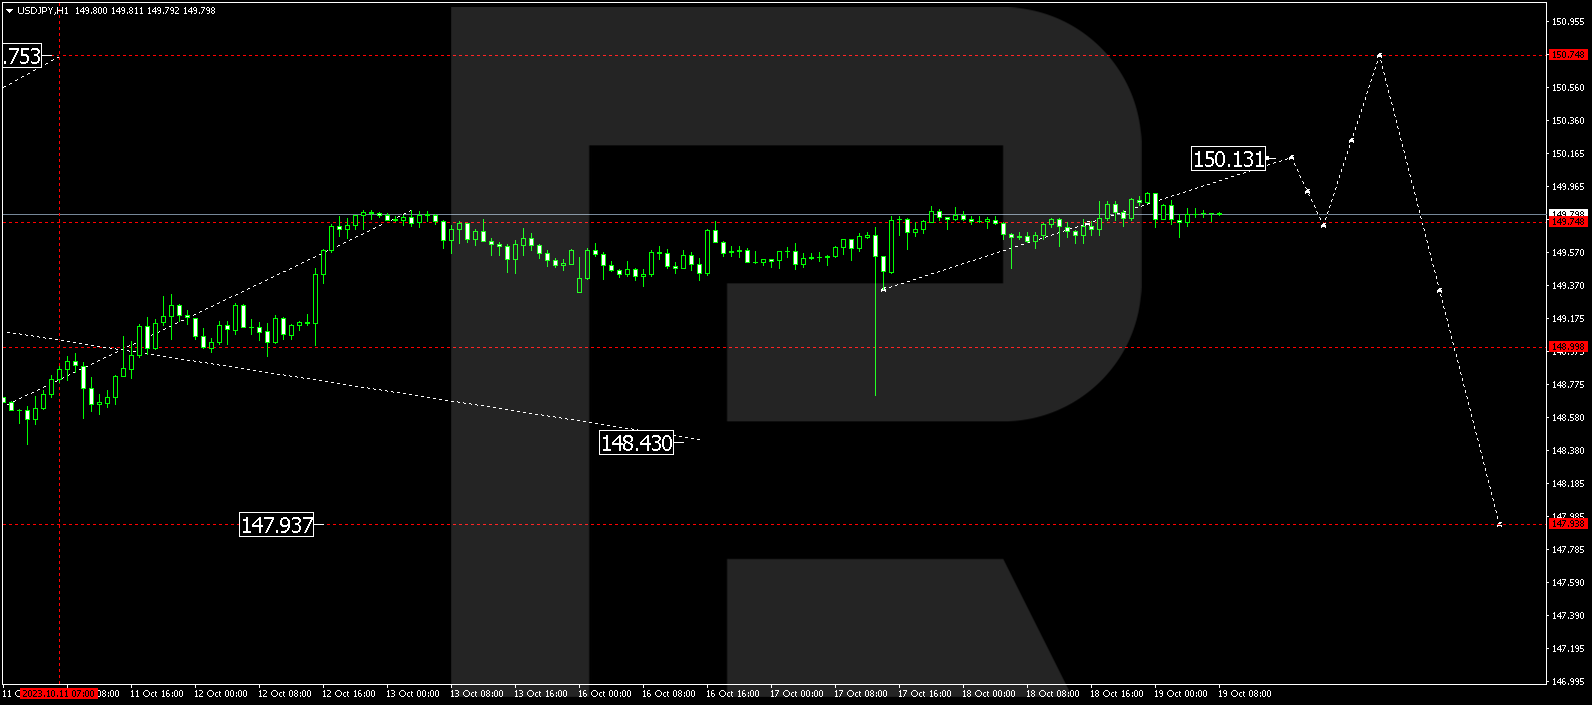
USD/JPY is currently consolidating within the range of 149.75. A breakout to the upside could set the stage for an upward movement to 150.13. Conversely, if it escapes to the downside, a correction to 149.00 is plausible, followed by a potential ascent to 150.75.


USD/CHF (US Dollar vs Swiss Franc)
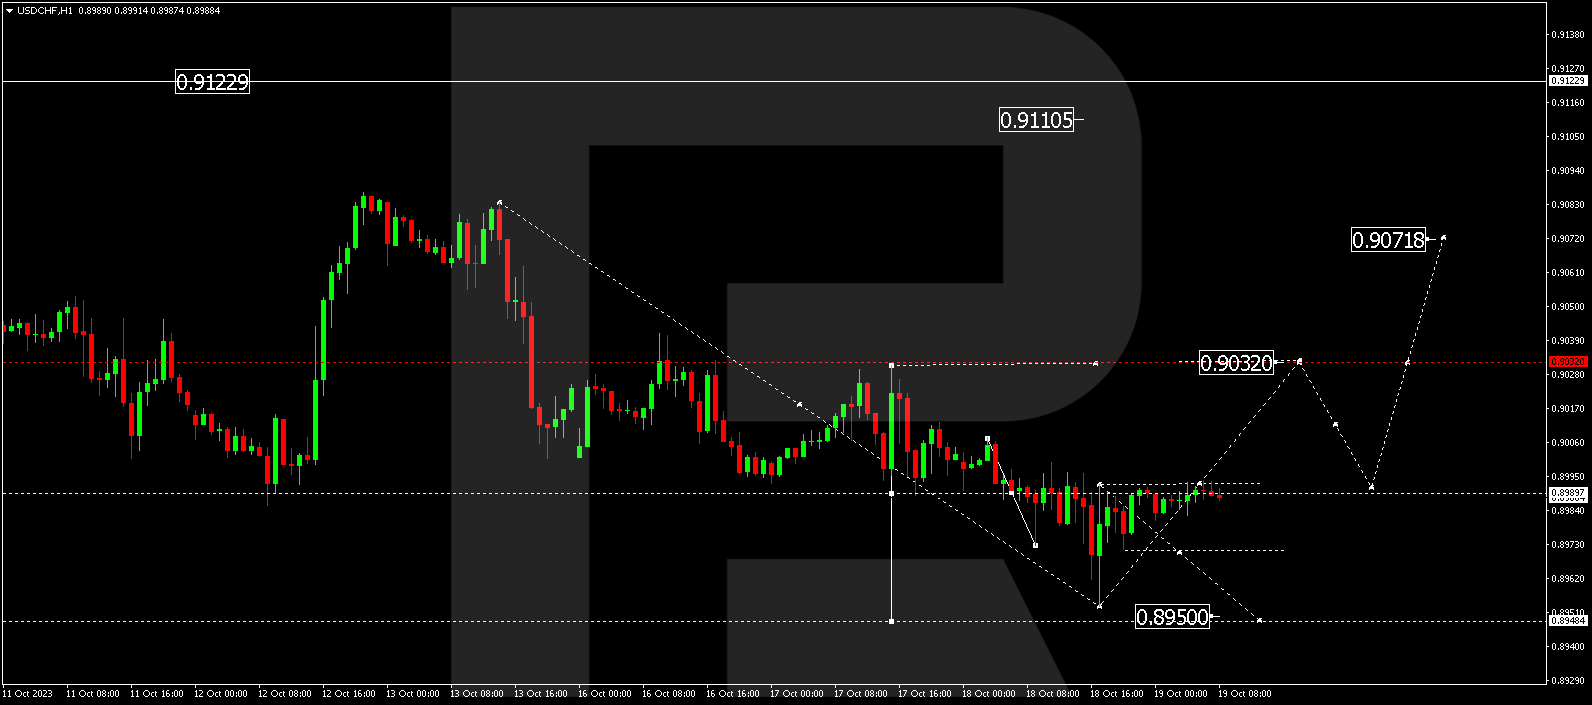
USD/CHF completed a move to 0.8953 within a declining wave. Today, the market initiated a correction towards 0.8989 (with a test from below). A new downward movement to 0.8950 might materialize. After reaching this level, the price may trigger an upward wave to 0.9033.
AUD/USD (Australian Dollar vs US Dollar)
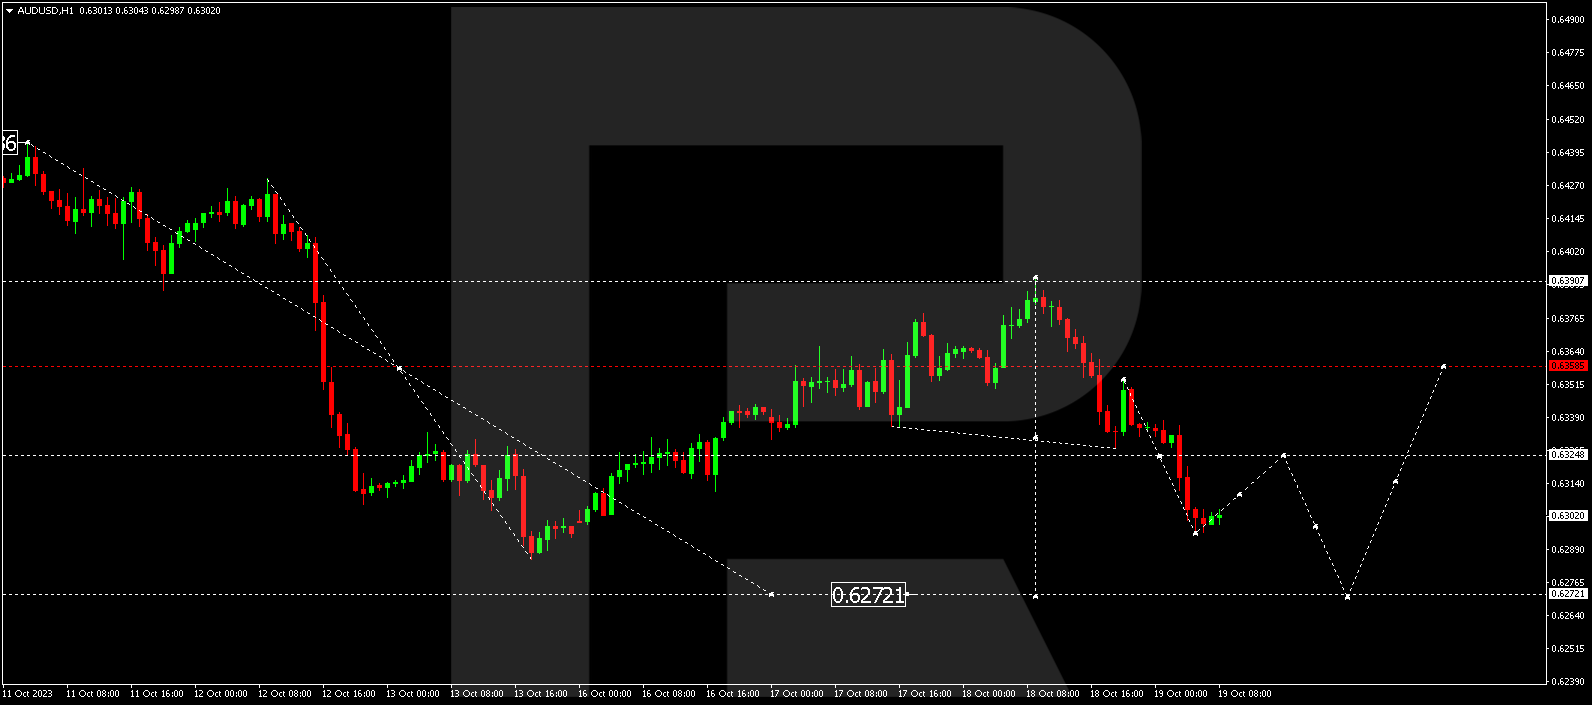
AUD/USD is persisting in its descent towards 0.6272. Once this level is reached, a corrective phase to 0.6358 is plausible, followed by a potential drop to 0.6200.
BRENT
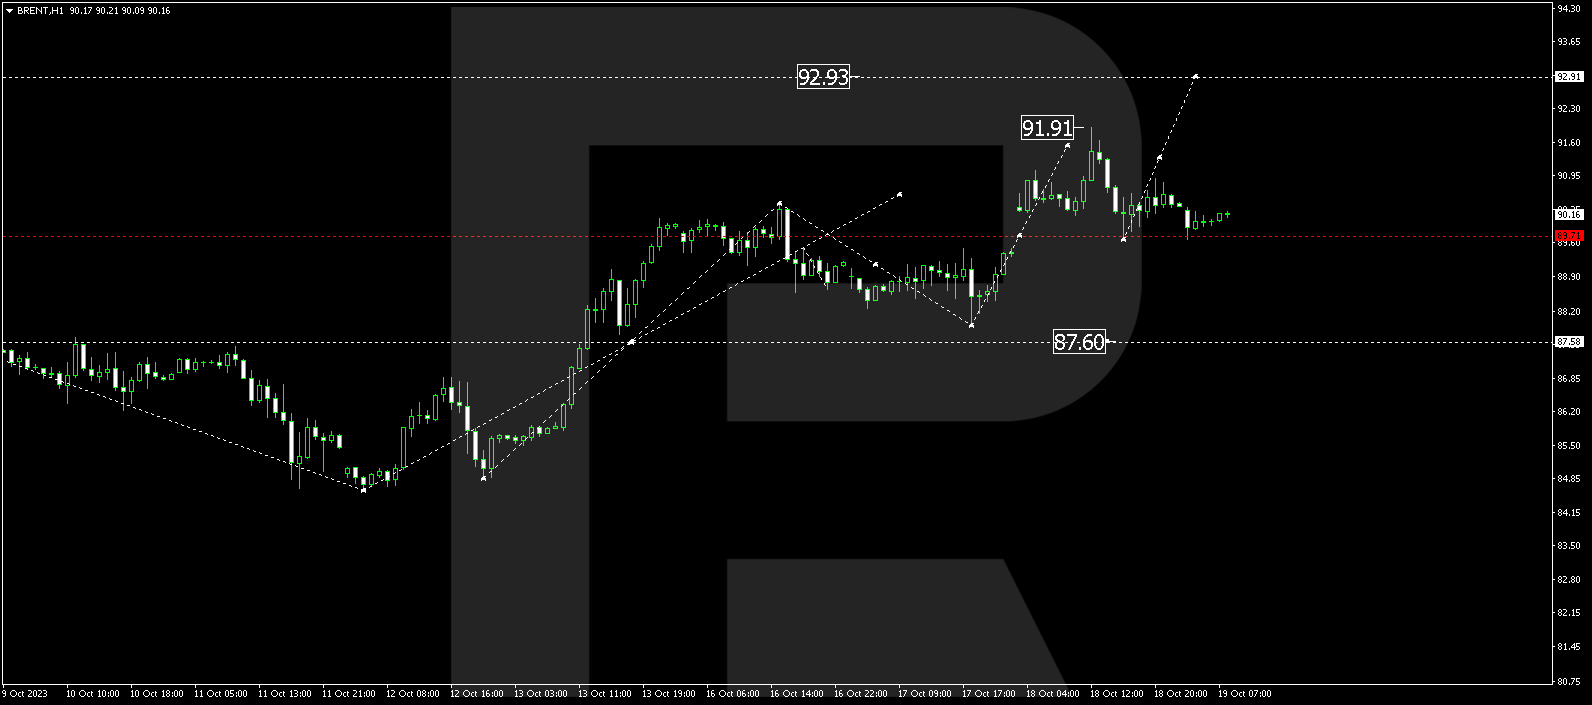
Brent is still in the process of forming a consolidation range above 89.70. If it breaks out to the upside, the potential for an upswing to 92.92 is on the horizon. Conversely, if it escapes to the downside, a corrective phase to 87.60 might occur, followed by a potential rise to 95.00.
XAU/USD (Gold vs US Dollar)
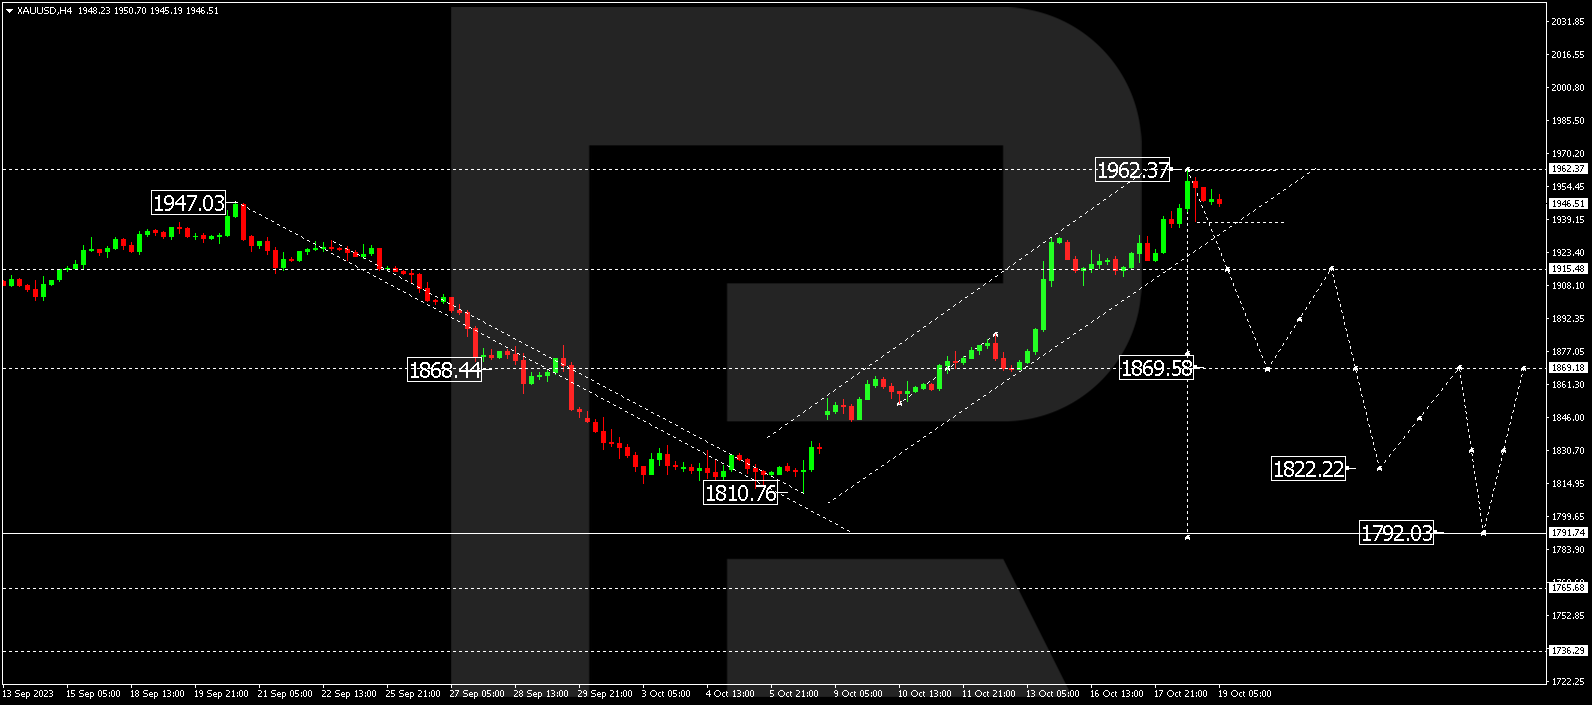
Gold is maintaining a consolidation range above 1938.15. A break to the downside could incite a declining wave down to 1869.60, which is the initial target. Subsequently, we might see a rebound to 1915.50 and then another drop to 1822.22. The trend could further continue to 1792.00 from there.
S&P 500
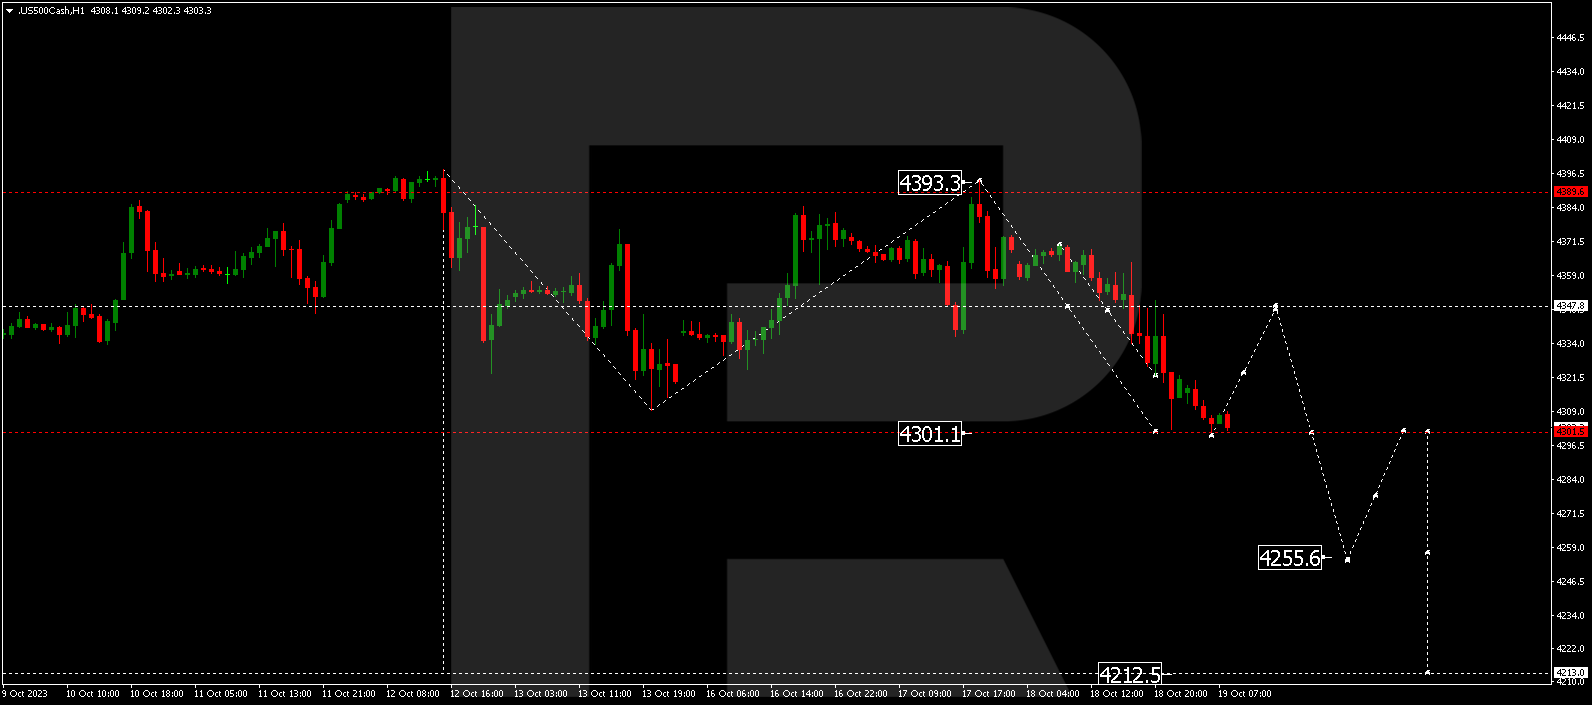
The stock index recently wrapped up a downswing to 4301.3. A consolidation range might evolve around this level today. In the event of an upward breakout, a correction towards 4347.0 is possible (with a test from below). Subsequently, a decline to 4255.5 could follow, representing a local target.
The post Technical Analysis & Forecast October 19, 2023 appeared first at R Blog – RoboForex.