
Brent Crude Oil Extends Its Growth: Here’s an Overview of EUR, GBP, JPY, CHF, AUD, Gold, and the S&P 500 Index.
EUR/USD (Euro vs US Dollar)
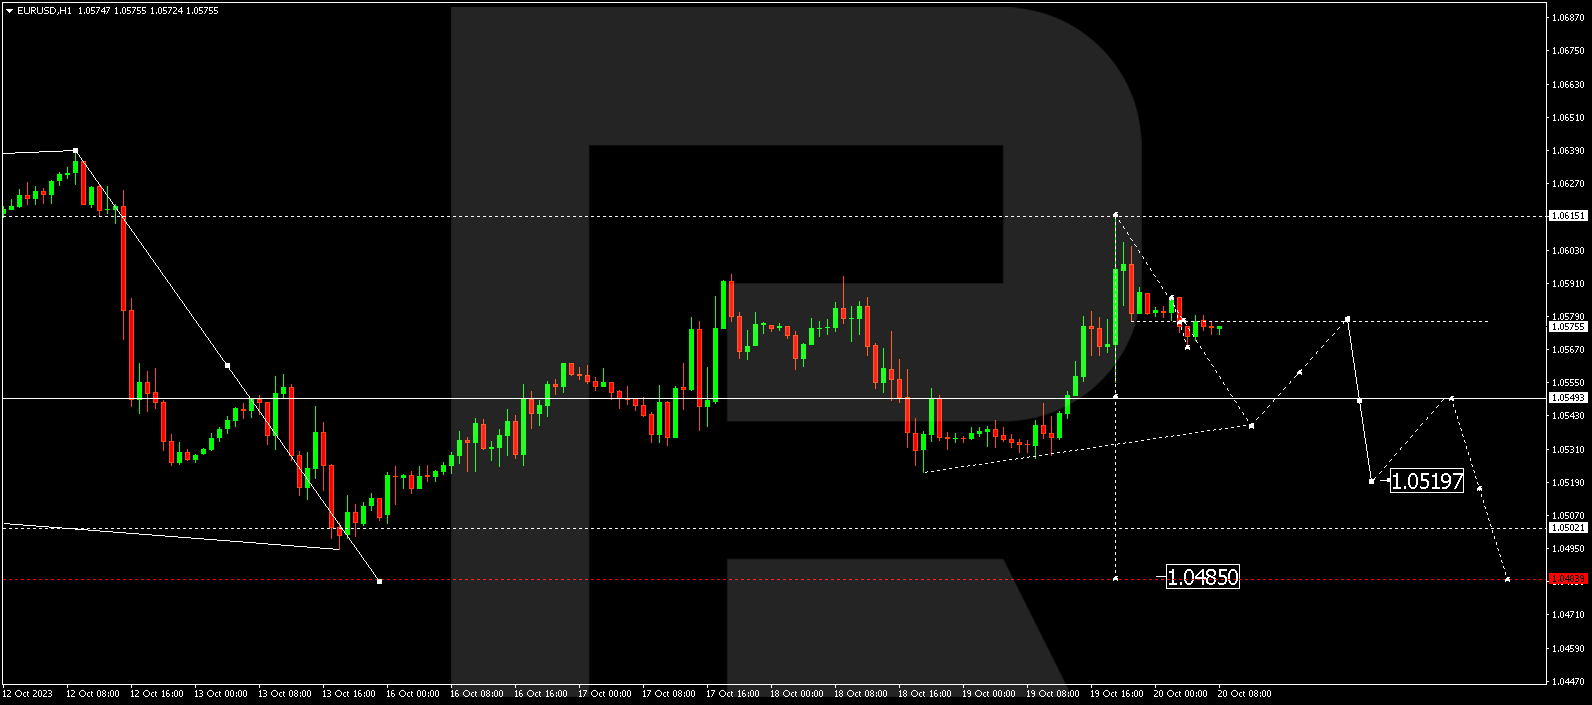
EUR/USD has broken free from a consolidation range, initiating a corrective wave towards 1.0650. Currently, a downward movement to 1.0530 is taking shape. After reaching this level, there’s potential for an upward bounce to 1.0577 (with a test from below). Subsequently, a decline to 1.0520 is likely, and from there, the trend might continue to 1.0485.
GBP/USD (British Pound vs US Dollar)
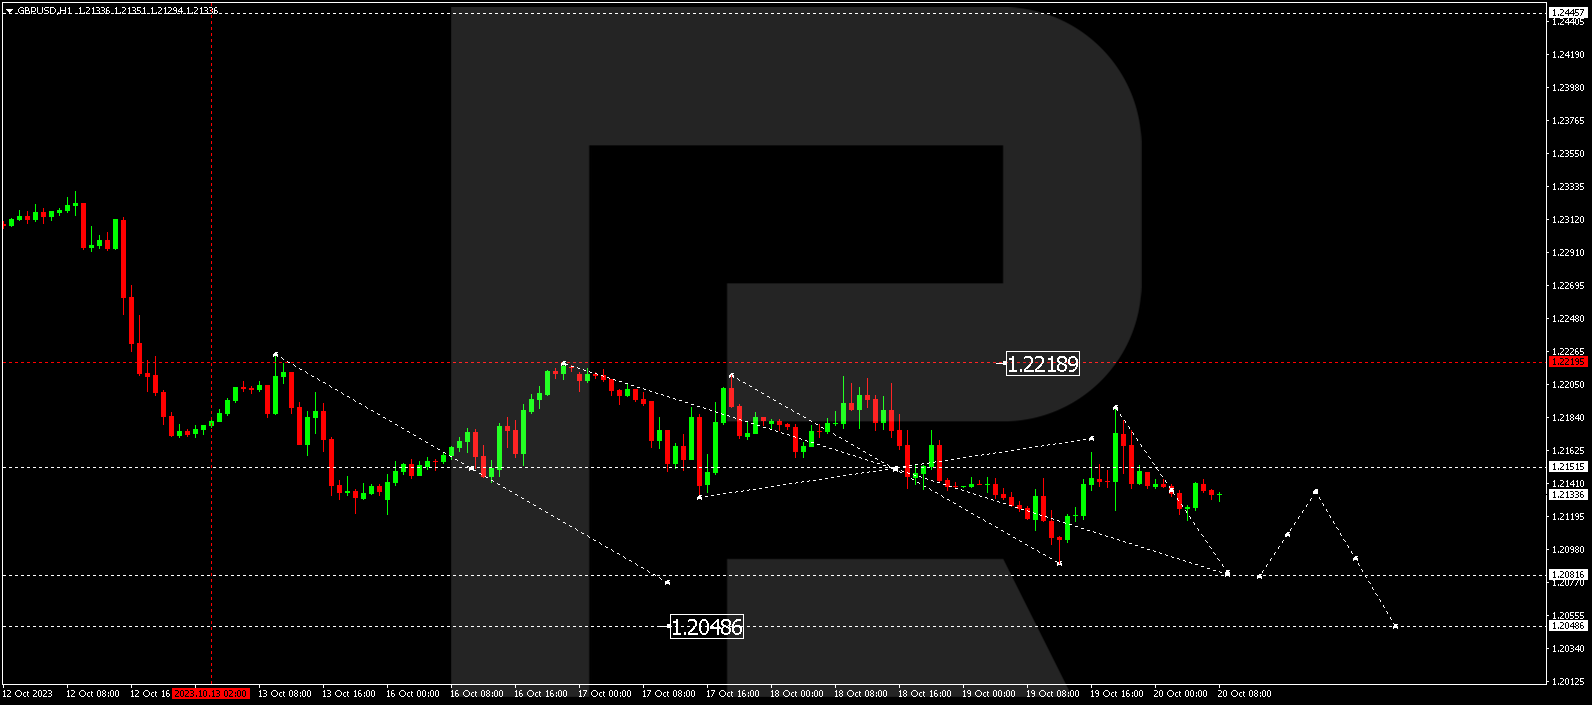
GBP/USD remains in a downward wave towards 1.2081. Once this level is reached, a corrective move to 1.2215 is possible, followed by another decline to 1.2048.
USD/JPY (US Dollar vs Japanese Yen)
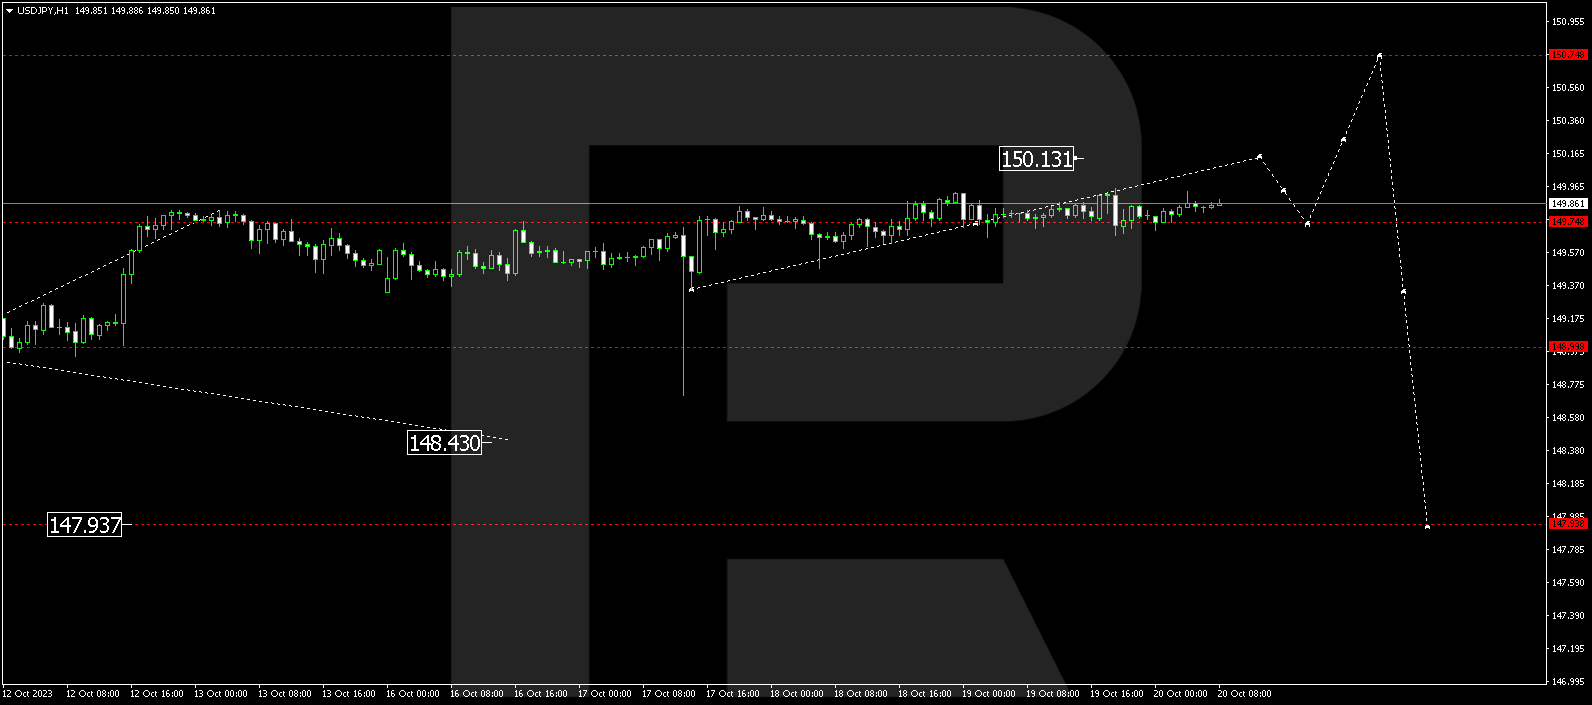
USD/JPY is in an upward wave targeting 150.13. After it hits this level, a correction down to 149.74 is possible, followed by a rise to 150.75.


USD/CHF (US Dollar vs Swiss Franc)
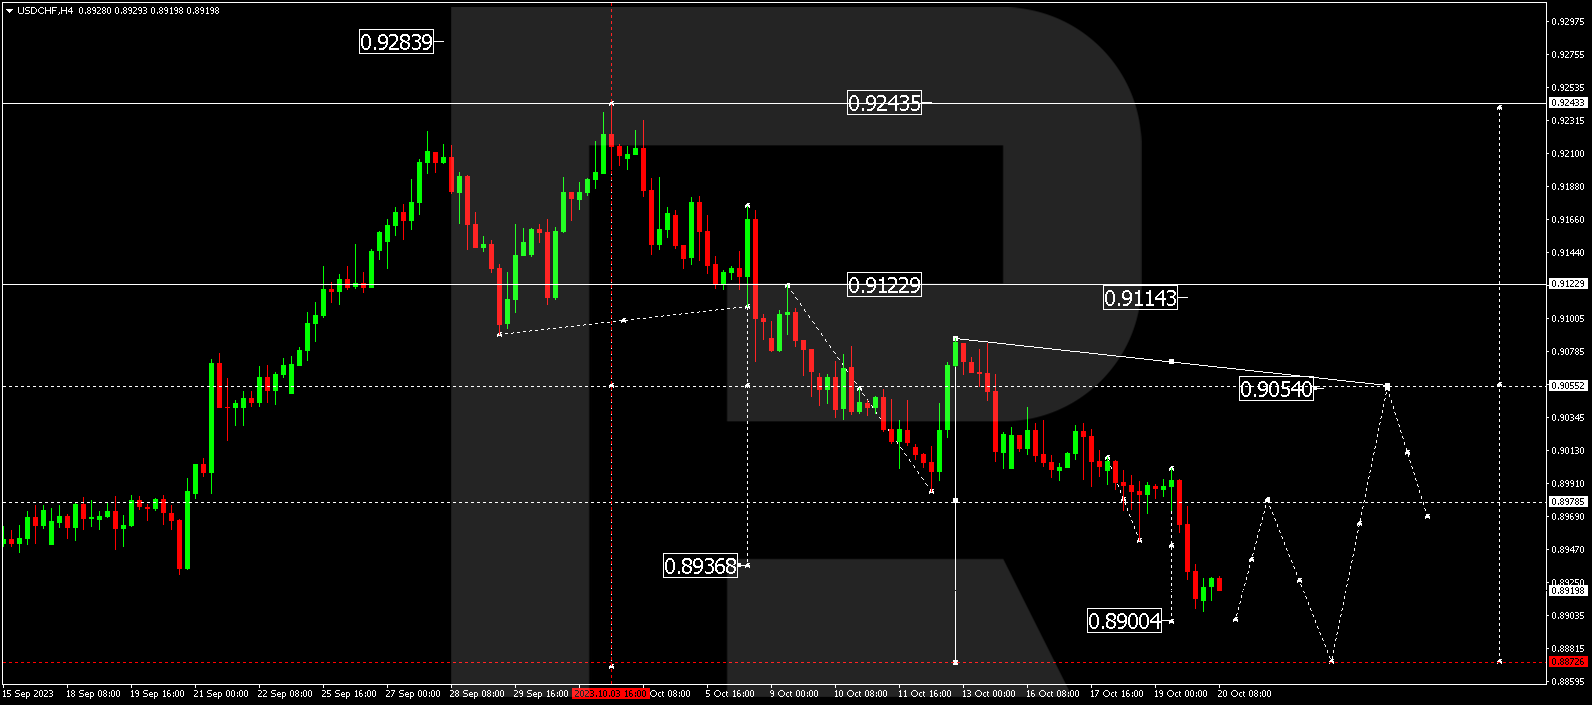
USD/CHF has concluded a move within a descending wave at 0.8908. It may see an upward bounce to 0.8980 next. Subsequently, a decline to 0.8888 could occur, followed by a rise to 0.9054.
AUD/USD (Australian Dollar vs US Dollar)
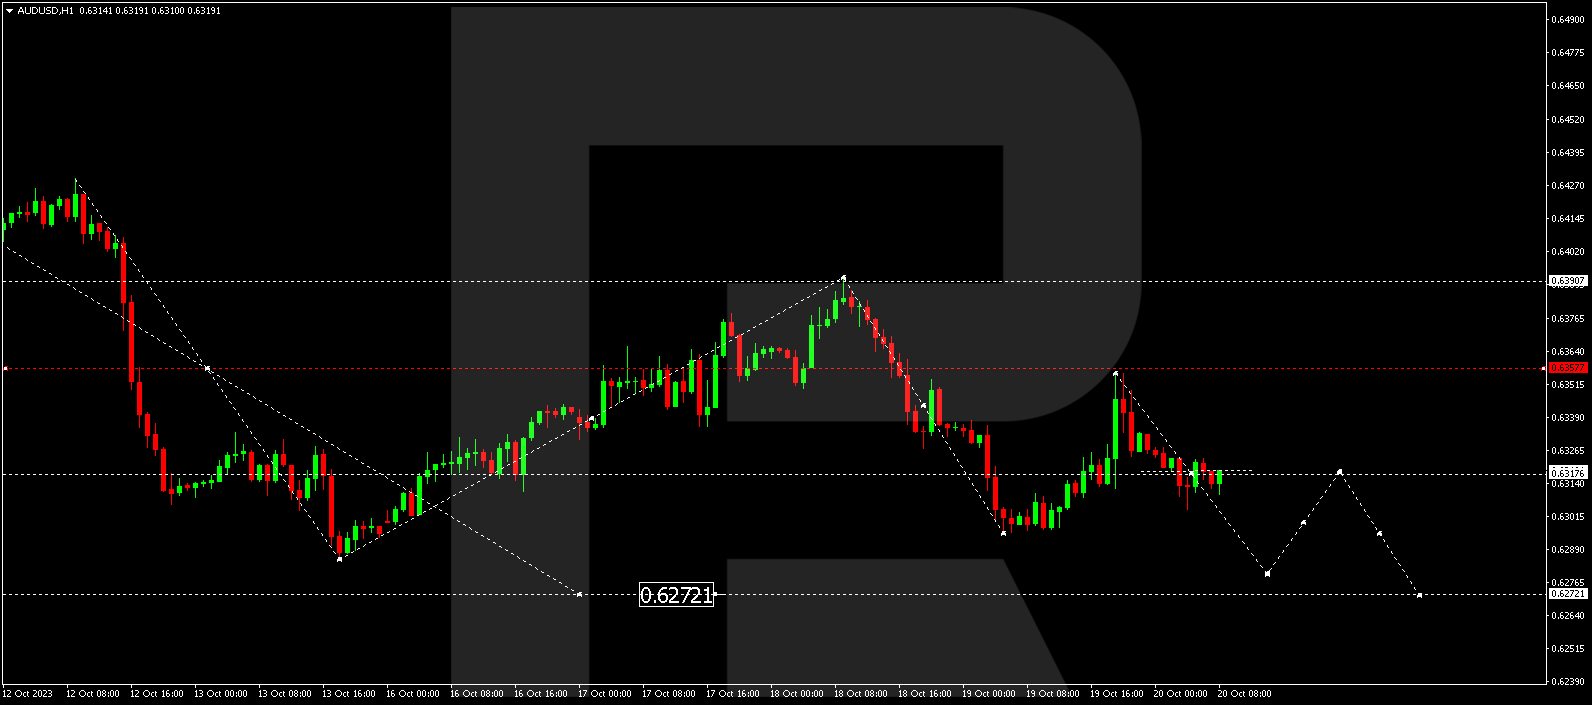
AUD/USD is in a downtrend heading towards 0.6279. After this level is reached, a correction to 0.6317 is possible, followed by another decline to 0.6272.
Brent
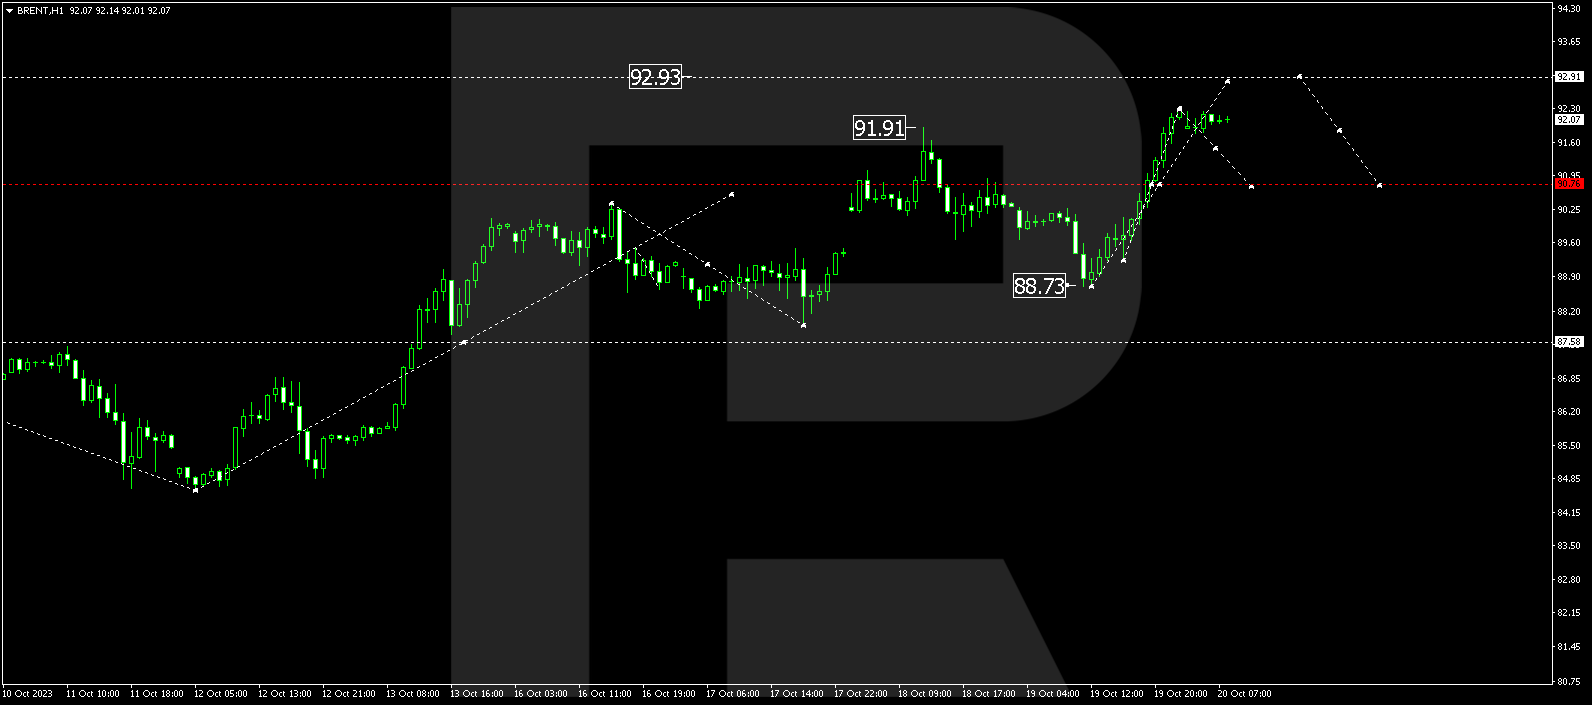
Brent is continuing an upward wave towards 92.92. After it reaches this level, there’s potential for a corrective move to 90.77. Subsequently, it might rise to 95.00, from where the trend could continue to 97.00.
XAU/USD (Gold vs US Dollar)
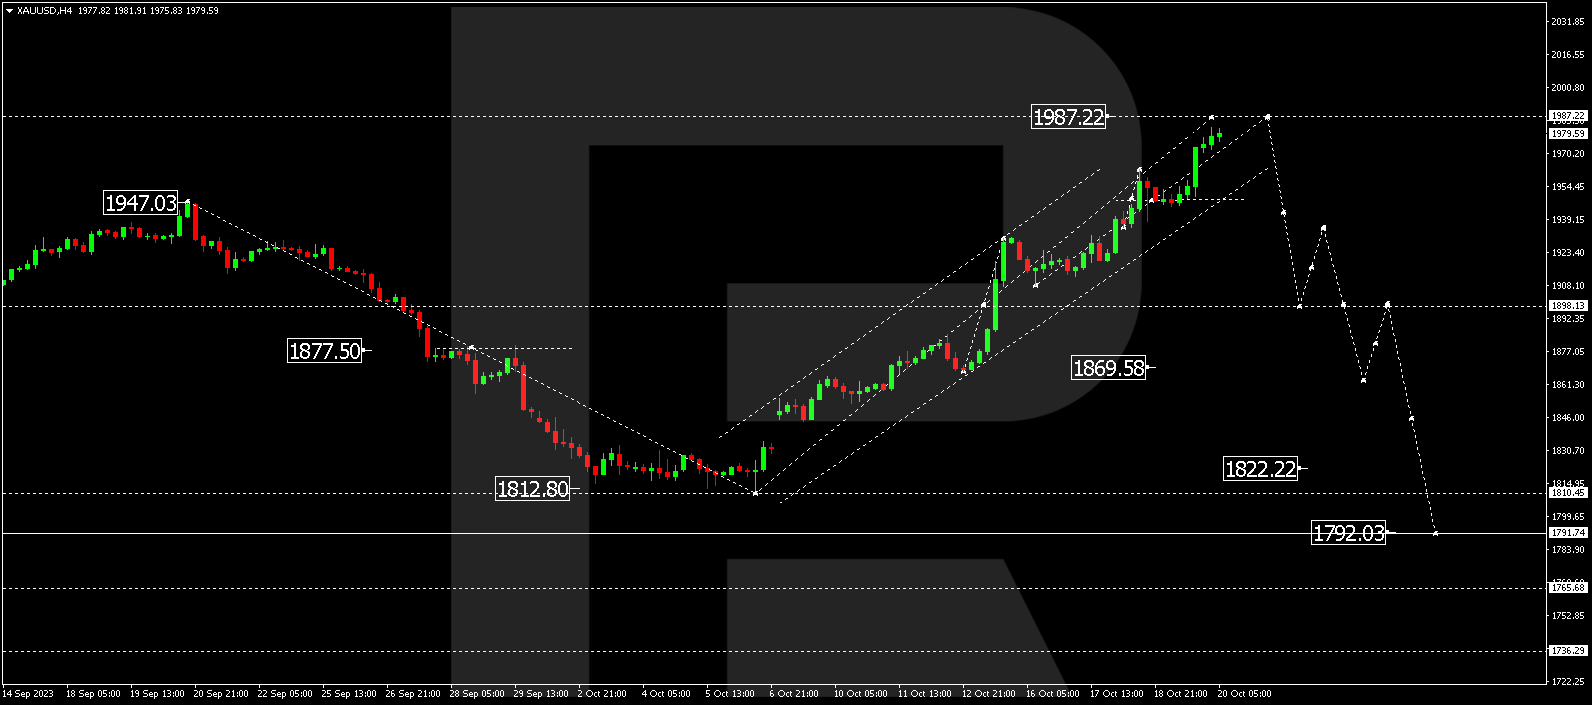
Gold is currently experiencing an upward wave towards 1987.22. After reaching this level, a new downward wave to 1898.00 is expected. Following that, a wave upwards to 1939.20 could materialize.
S&P 500
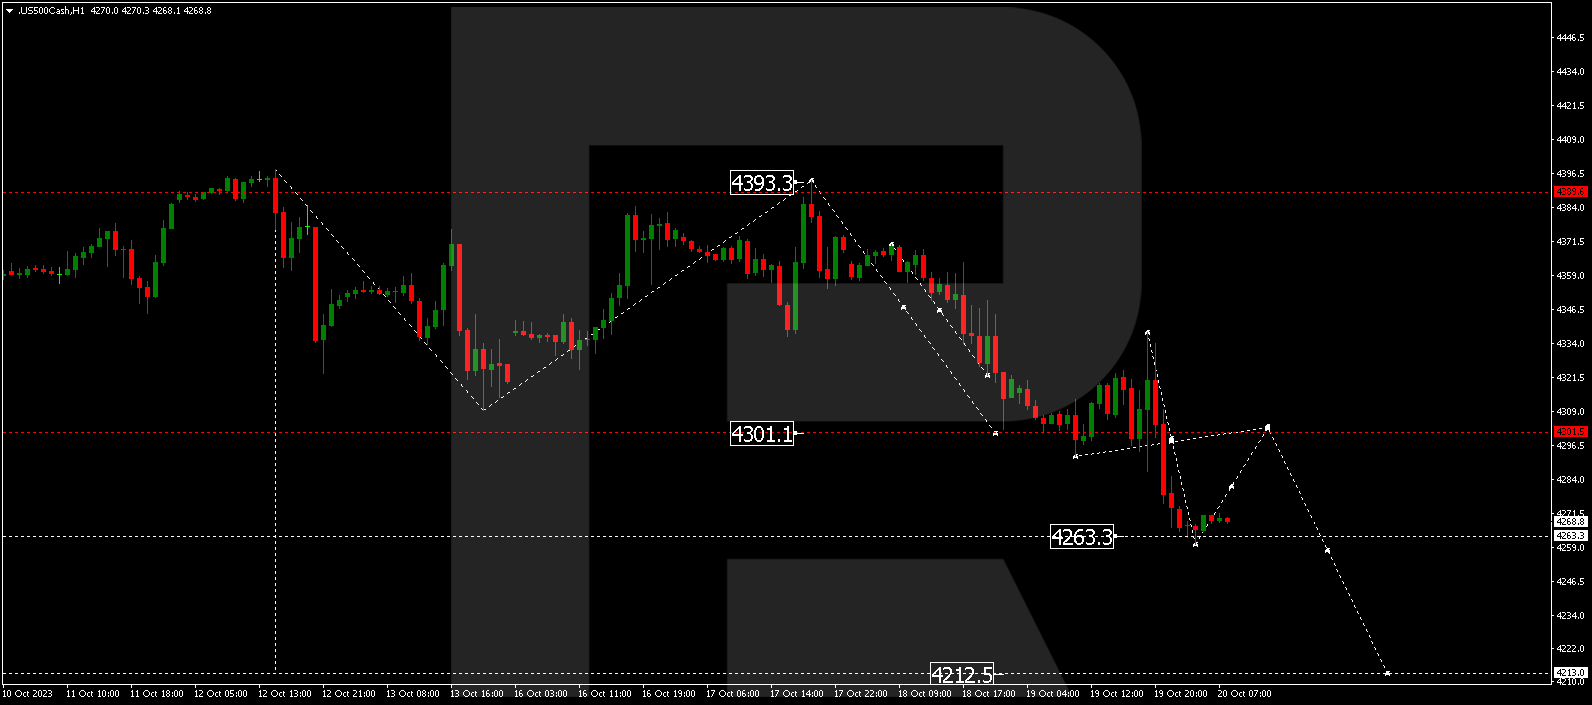
The stock index has completed a downward wave to 4263.3. Presently, the market is forming a consolidation range above this level. A corrective move to 4300.0 is possible next (with a test from below), followed by a decline to 4212.5.
The post Technical Analysis & Forecast October 20, 2023 appeared first at R Blog – RoboForex.