
Brent is concluding its correction. In this overview, we’ll also delve into the movements of EUR, GBP, JPY, CHF, AUD, Gold, and the S&P 500 index.
EUR/USD (Euro vs US Dollar)
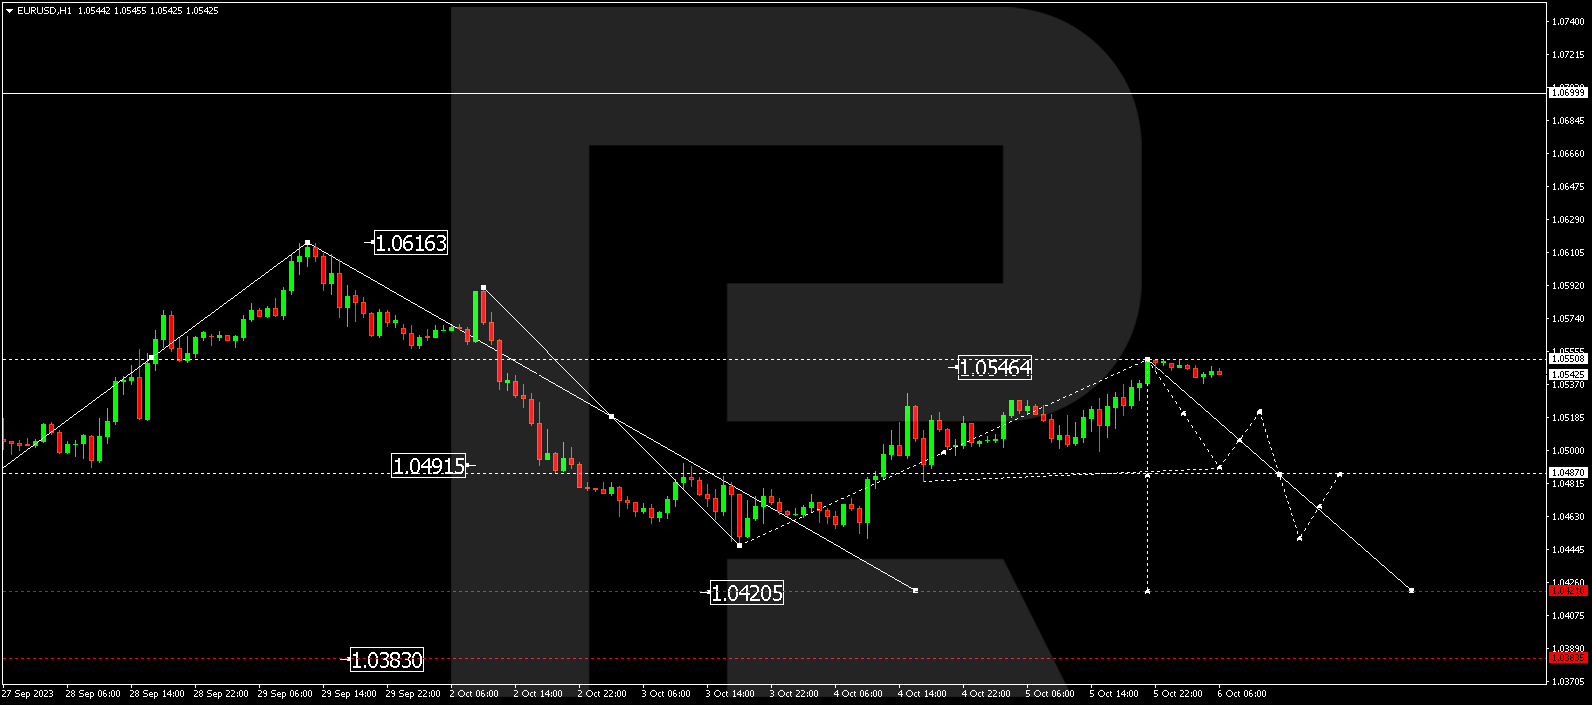
EUR/USD experienced a corrective shift to 1.0550. Currently, the market is consolidating below this level. Anticipate a downward movement to 1.0487 today. Notably, a broad consolidation range is forming around this level. A downward breakout from this range could extend the decline to 1.0421. Conversely, an upward breakout might prolong the corrective wave to 1.0611.
GBP/USD (Great Britain Pound vs US Dollar)
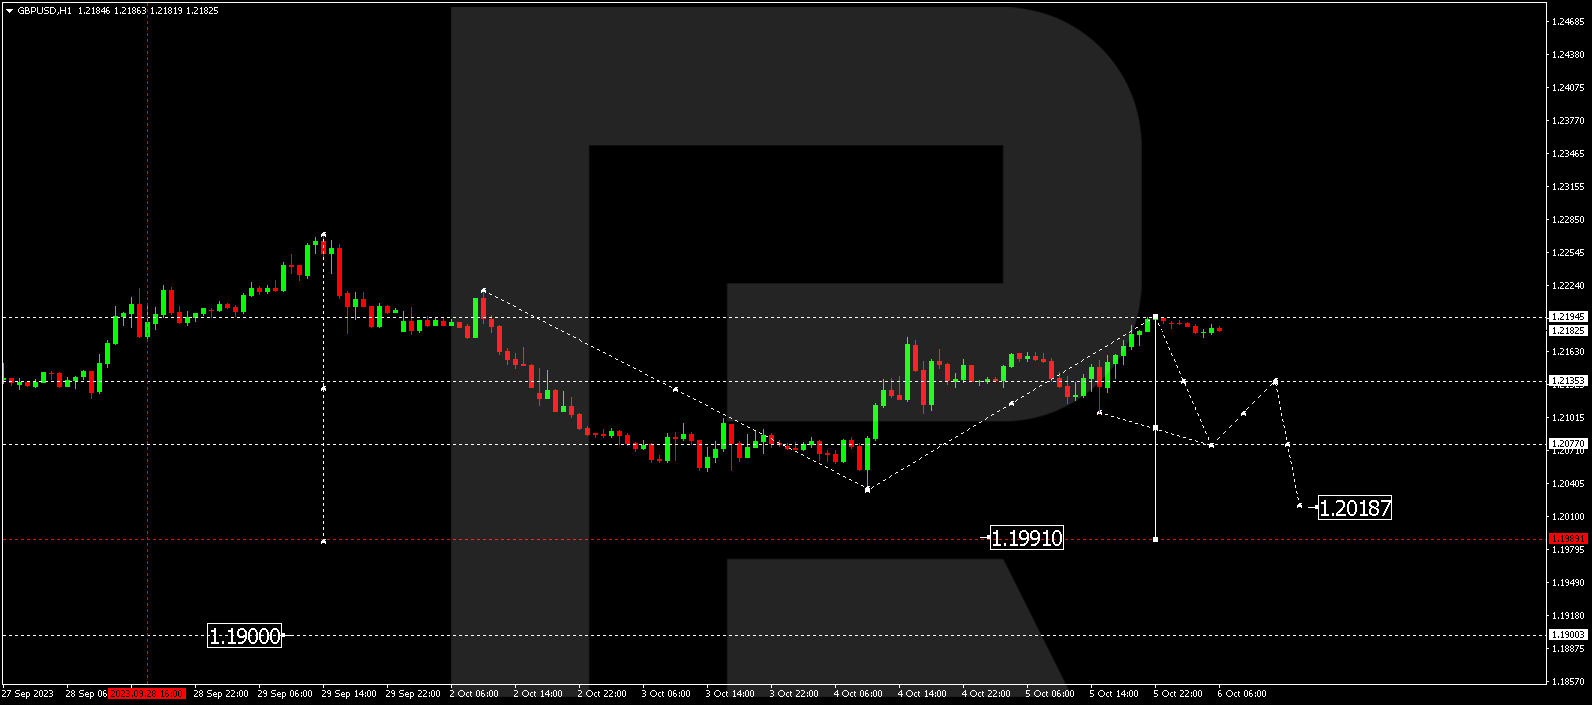
GBP/USD saw an upward surge to 1.2194. Presently, the market is consolidating below this level. A decline to 1.2080 is plausible today. Essentially, a consolidation range is forming around 1.2106. Should there be an upward breakout, the correction might extend to 1.2300. Conversely, a downward breakout could trigger a decline to 1.1990, from where the trend could continue to 1.1900.
USD/JPY (US Dollar vs Japanese Yen)
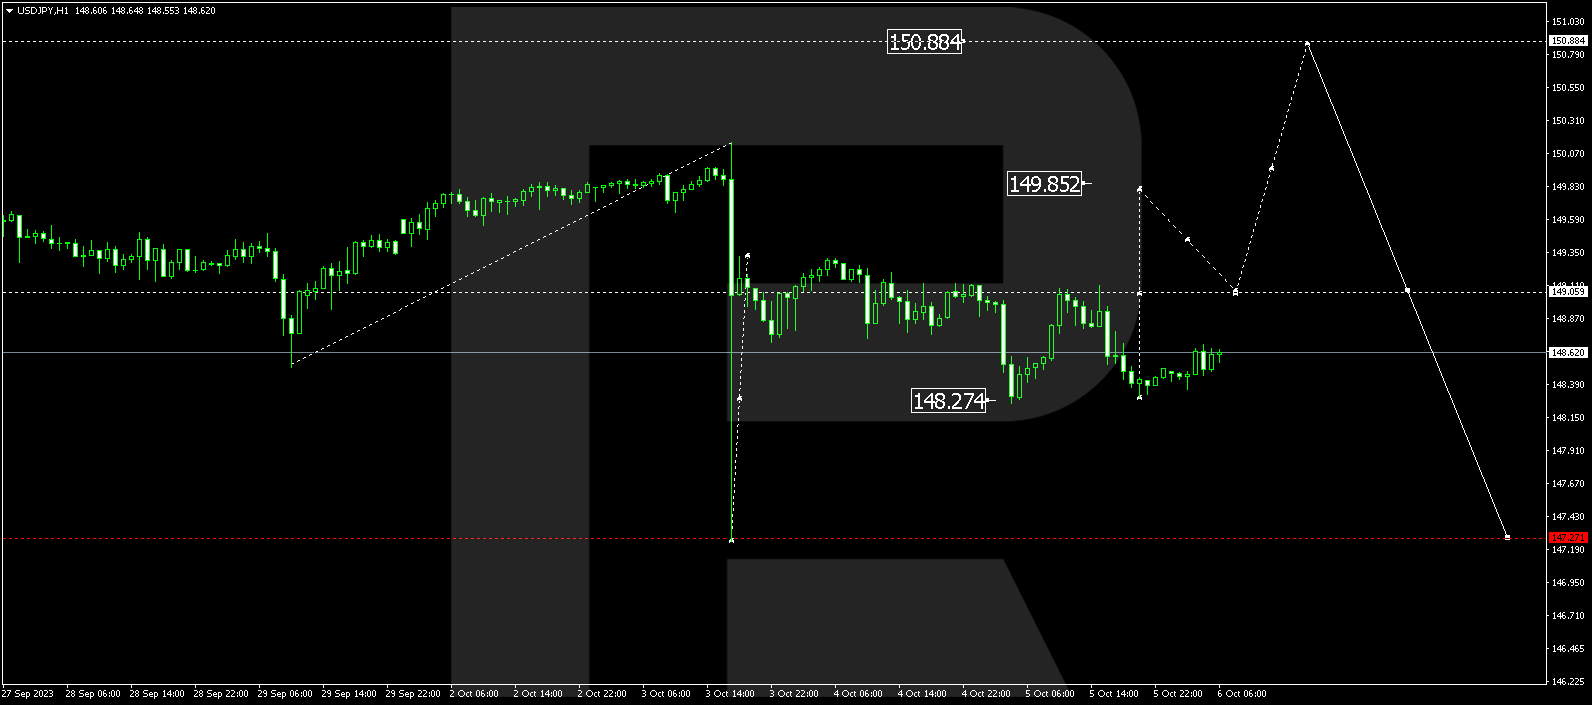
USD/JPY is actively developing a consolidation range above 148.30. Today, the pair could rise to 149.06. If this level is breached upwards, the potential for an ascent to 149.85 might materialize, followed by a decline to 149.06 (with a test from above). Subsequently, growth towards 150.88 could ensue. In case the 148.30 level is breached downwards, it might pave the way for a further correction to 147.27.


USD/CHF (US Dollar vs Swiss Franc)
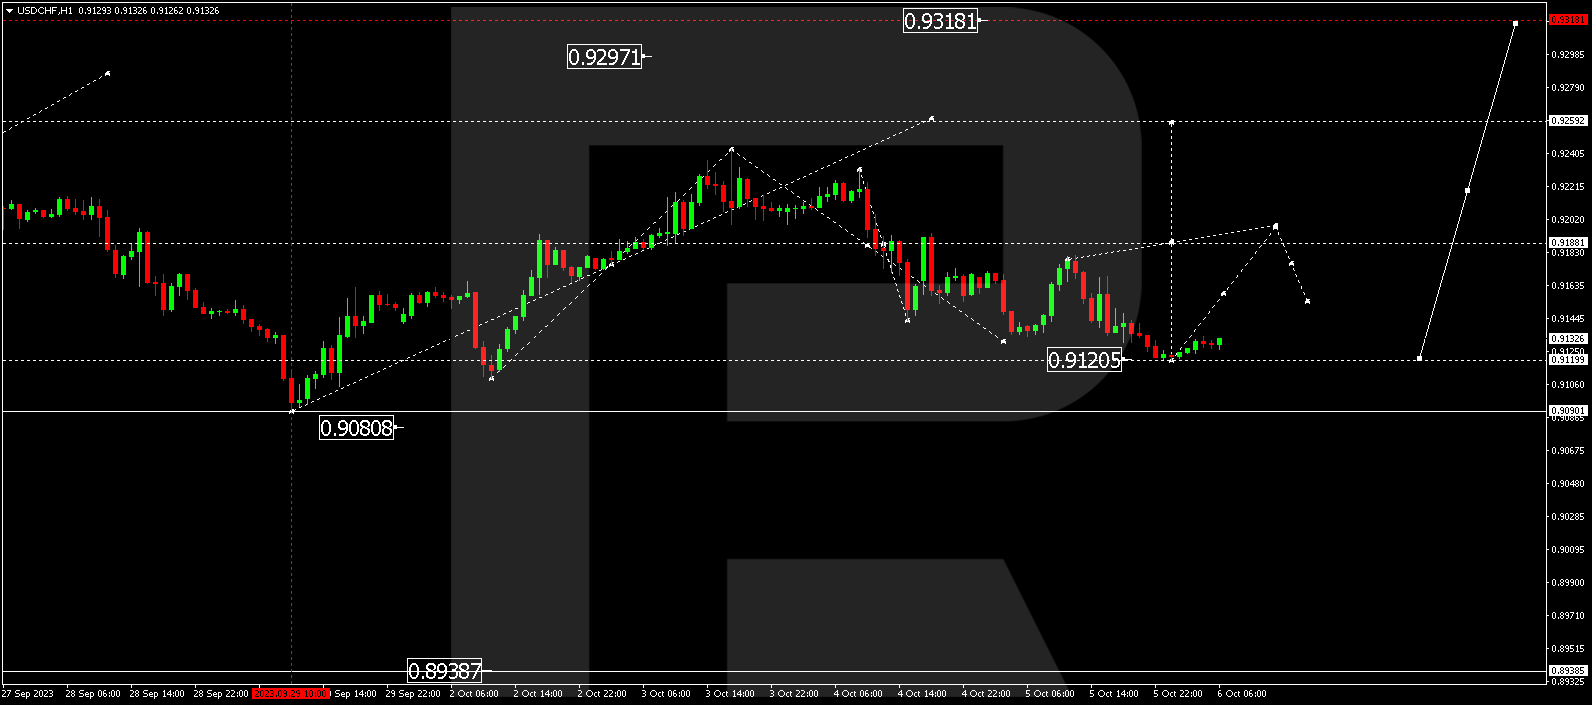
USD/CHF has successfully completed a corrective wave to 0.9120. Today, the market is forming a consolidation range above this level. An upward breakout from this range is anticipated, followed by further development of the wave to 0.9200 and a potential trend extension to the 0.9318 level.
AUD/USD (Australian Dollar vs US Dollar)
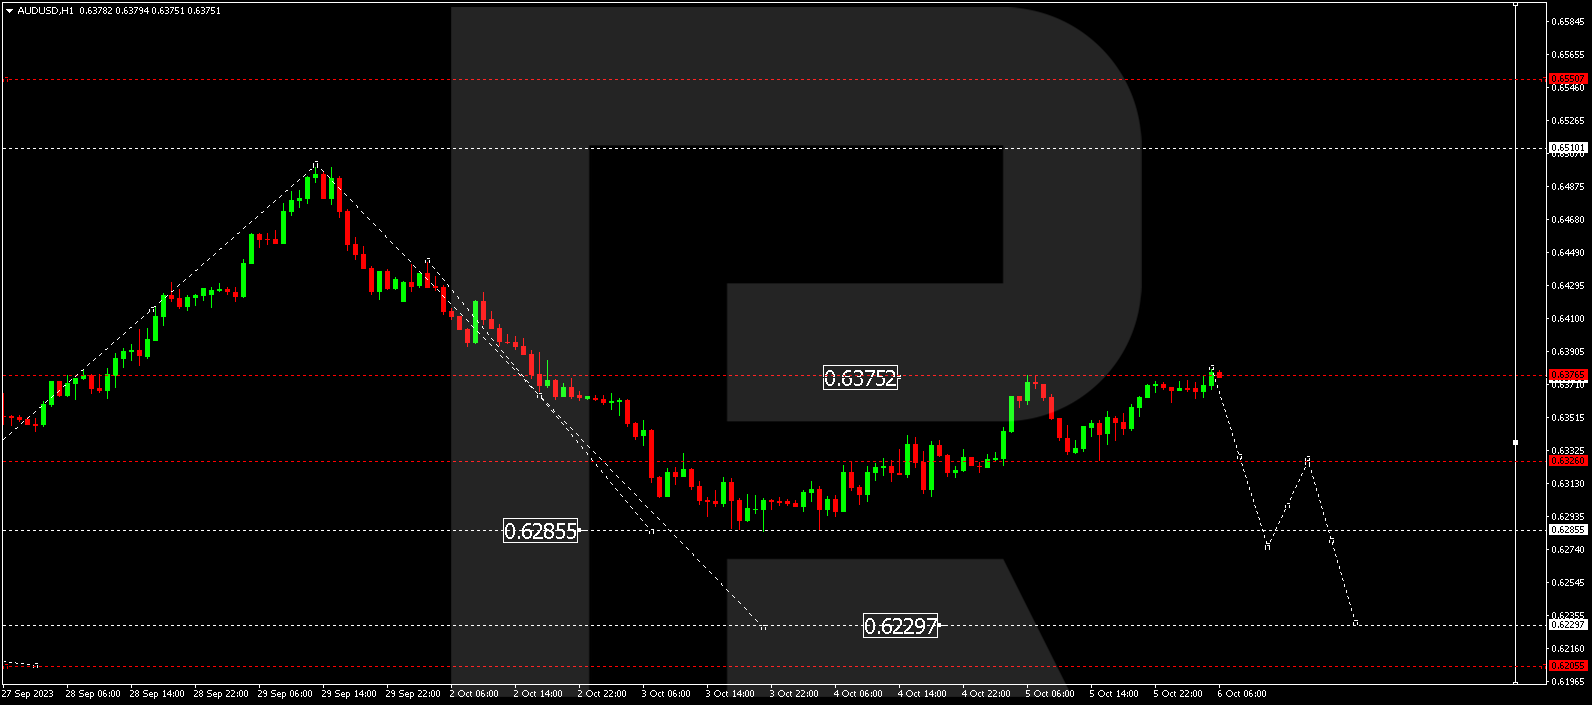
AUD/USD has completed a corrective wave to 0.6380. Today, a consolidation range is forming below this level. An anticipated decline to 0.6326 is on the horizon. Notably, a wide consolidation range is materializing around 0.6326. An upward breakout might extend the correction to 0.6450, while a downward breakout could open the potential for a decline to 0.6277, subsequently extending the trend to 0.6229.
BRENT
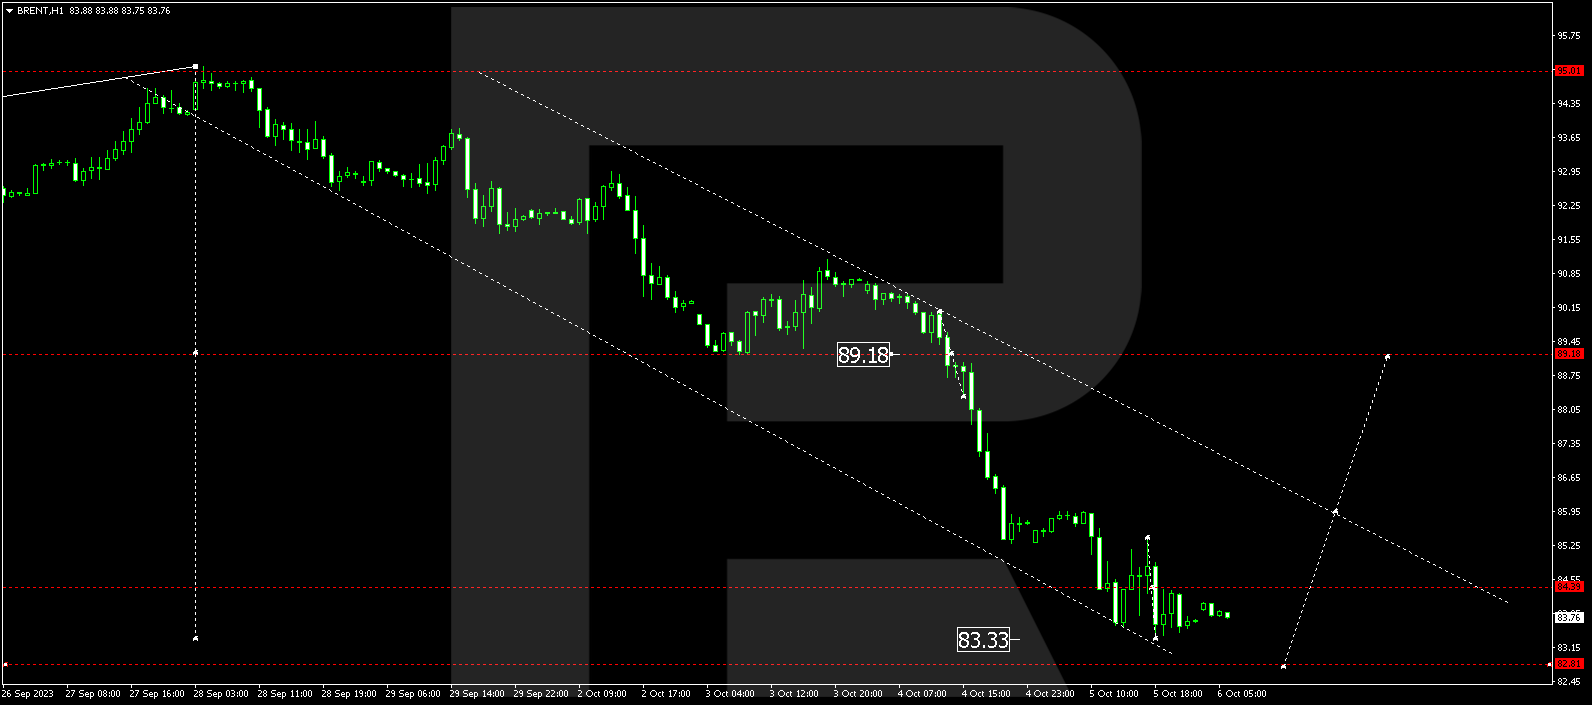
Brent has structured a consolidation range above 89.20. Escaping this range downwards, it completed a downward movement to 84.40. Today, the market is consolidating within a range around this level. It might extend to 82.82. After the price reaches this point, a new wave of decline to 90.00 could form, leading the trend to continue to 95.00. This represents a local target.
XAU/USD (Gold vs US Dollar)
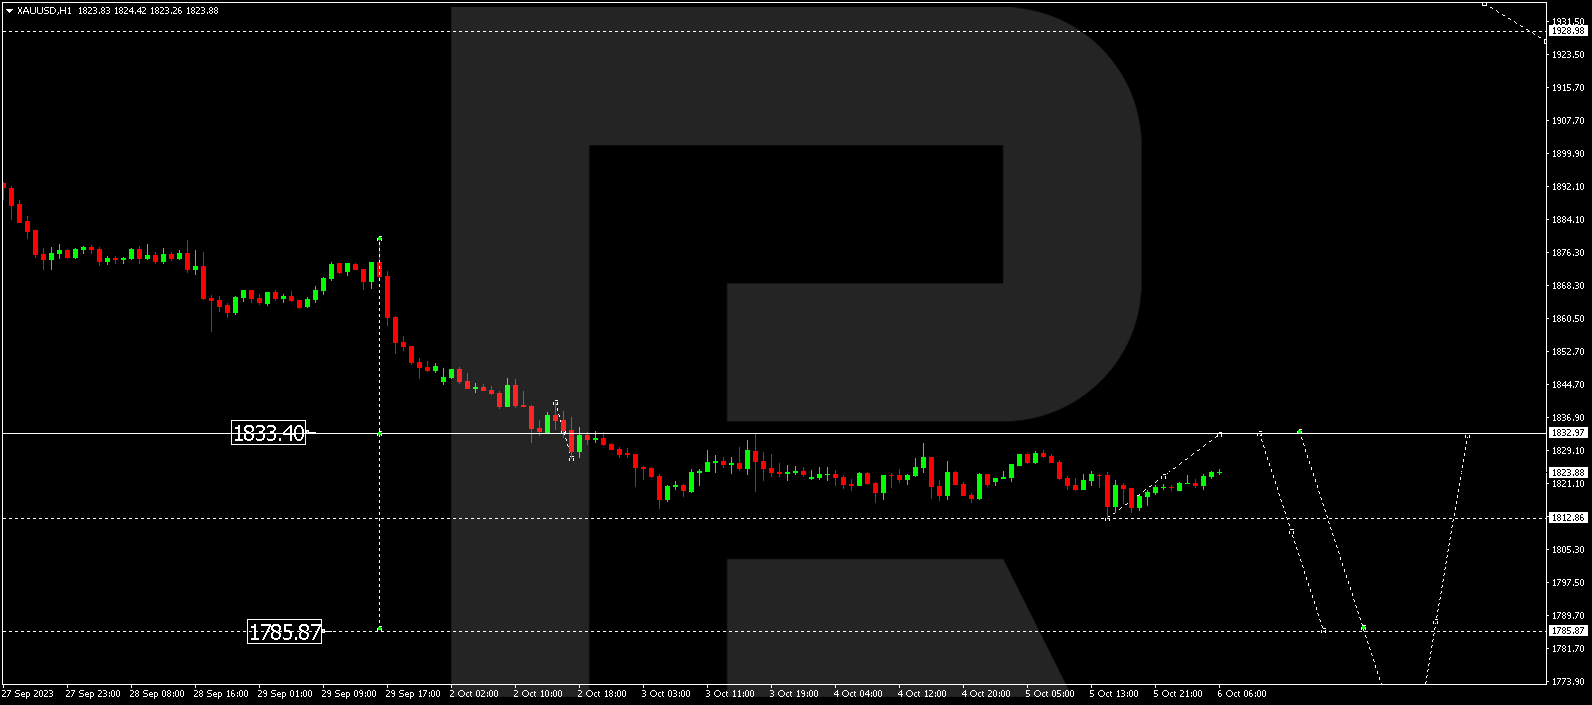
Gold has finalized a wave of decline to 1812.86. Today, a potential upward movement to 1833.00 could transpire (with a test from below). Next, a decline to 1785.87 is expected. This signifies a local target.
S&P 500
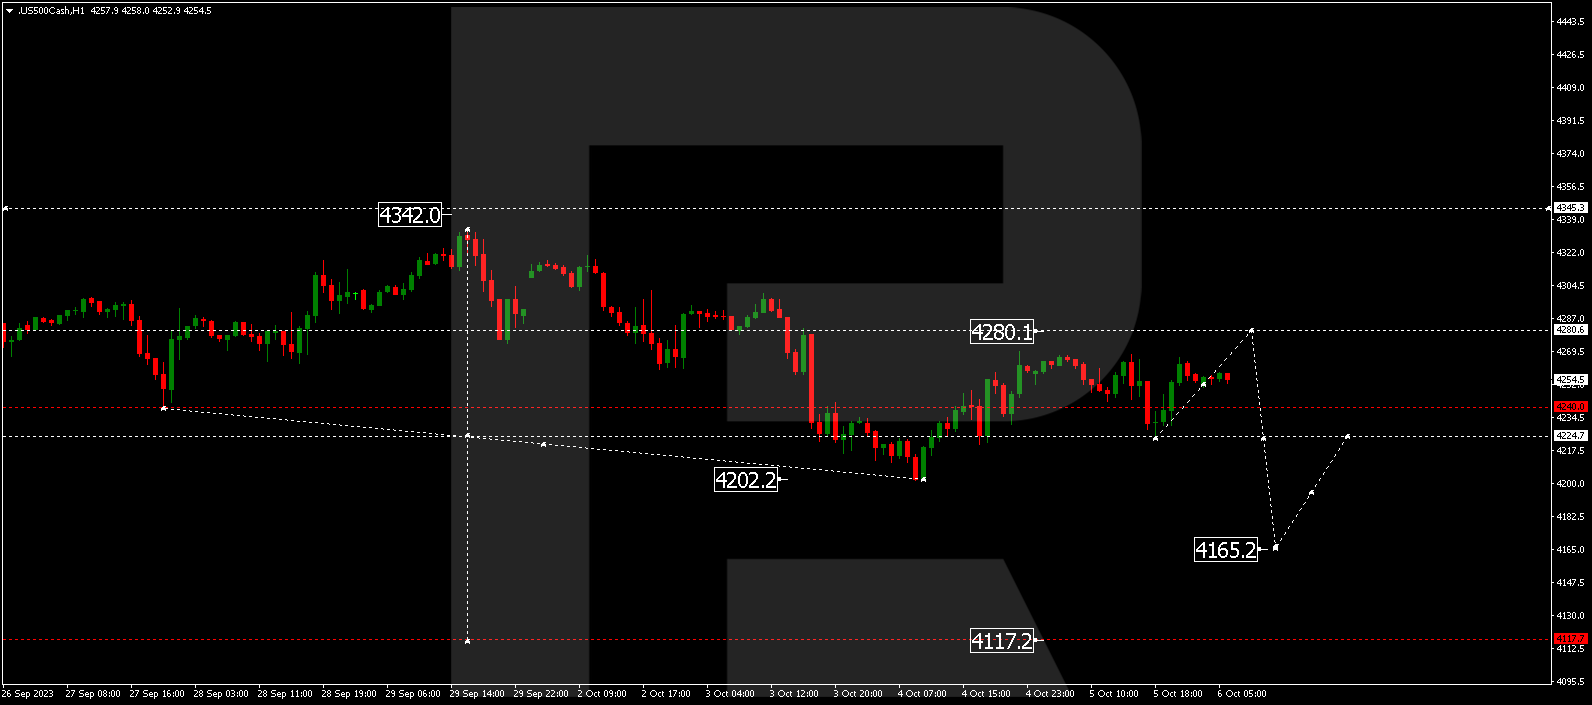
The stock index is persisting within a consolidation range around 4240.0. Today, an upward movement to 4280.0 is plausible (with a test from below). Next, the decline could persist, reaching 4165.0, paving the way for an extension to 4117.0. This stands as a local target.
The post Technical Analysis & Forecast October 6, 2023 appeared first at R Blog – RoboForex.