
Gold May Experience a Correction Before a New Decline. This overview also encompasses the dynamics of EUR, GBP, JPY, CHF, AUD, Brent, and the S&P 500 index.
EUR/USD (Euro vs US Dollar)
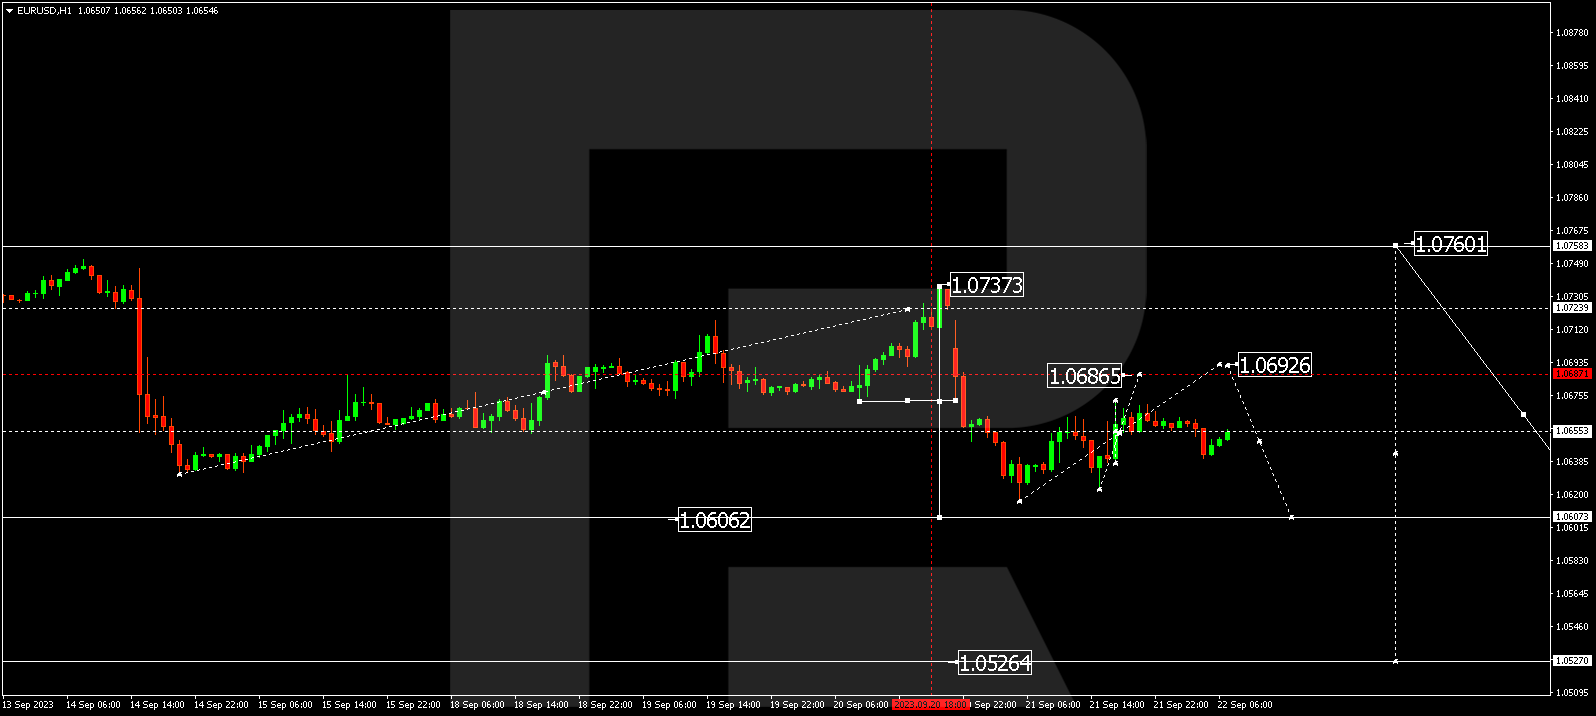
EUR/USD completed a downward wave to 1.0616. Today, the market might initiate a correction to 1.0686. After this correction, a new downward move to 1.0606 could follow, from where the trend might extend to 1.0570.
GBP/USD (Great Britain Pound vs US Dollar)
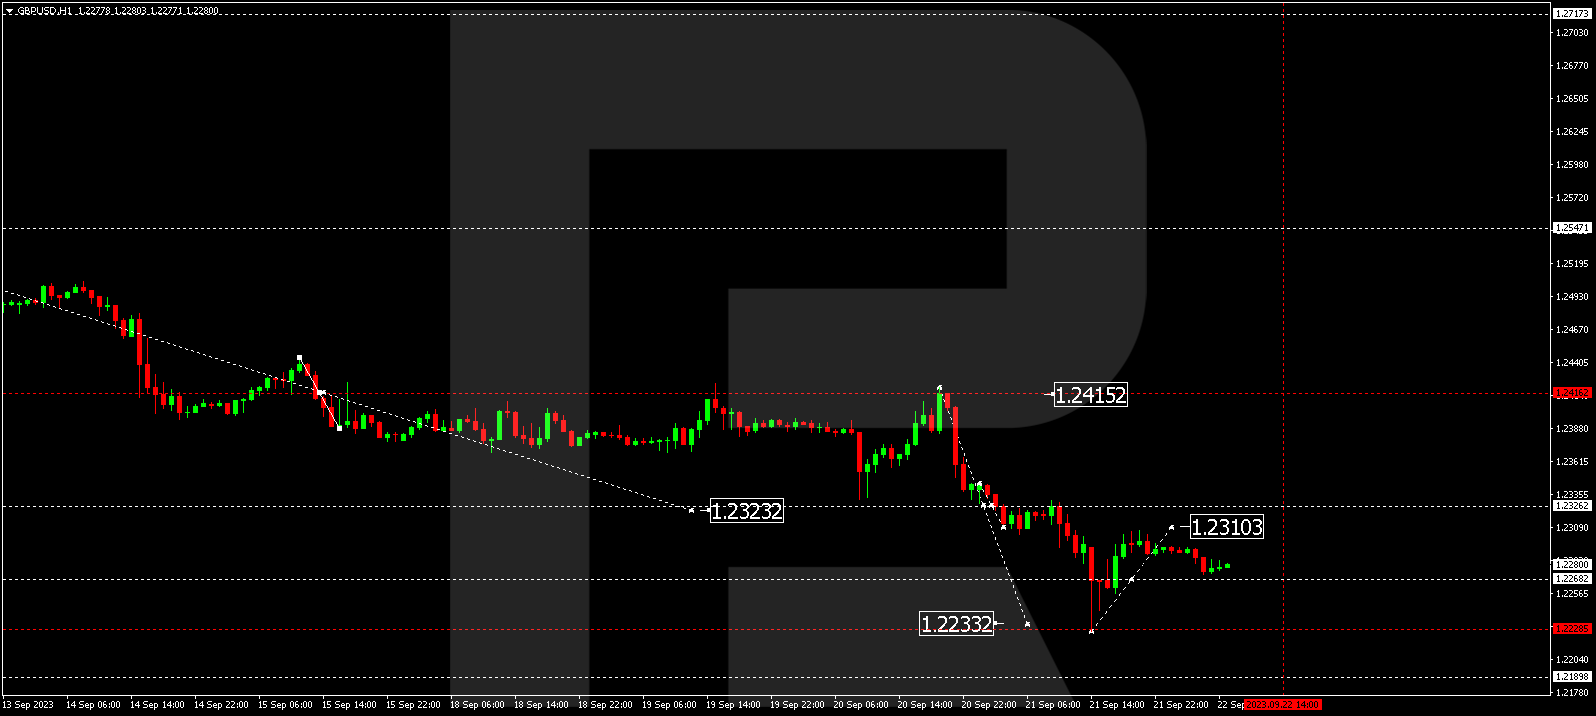
GBP/USD has concluded a downward wave to 1.2233. Today, the market could correct to 1.2310. After the correction, a new downward structure to 1.2190 might unfold.
USD/JPY (US Dollar vs Japanese Yen)
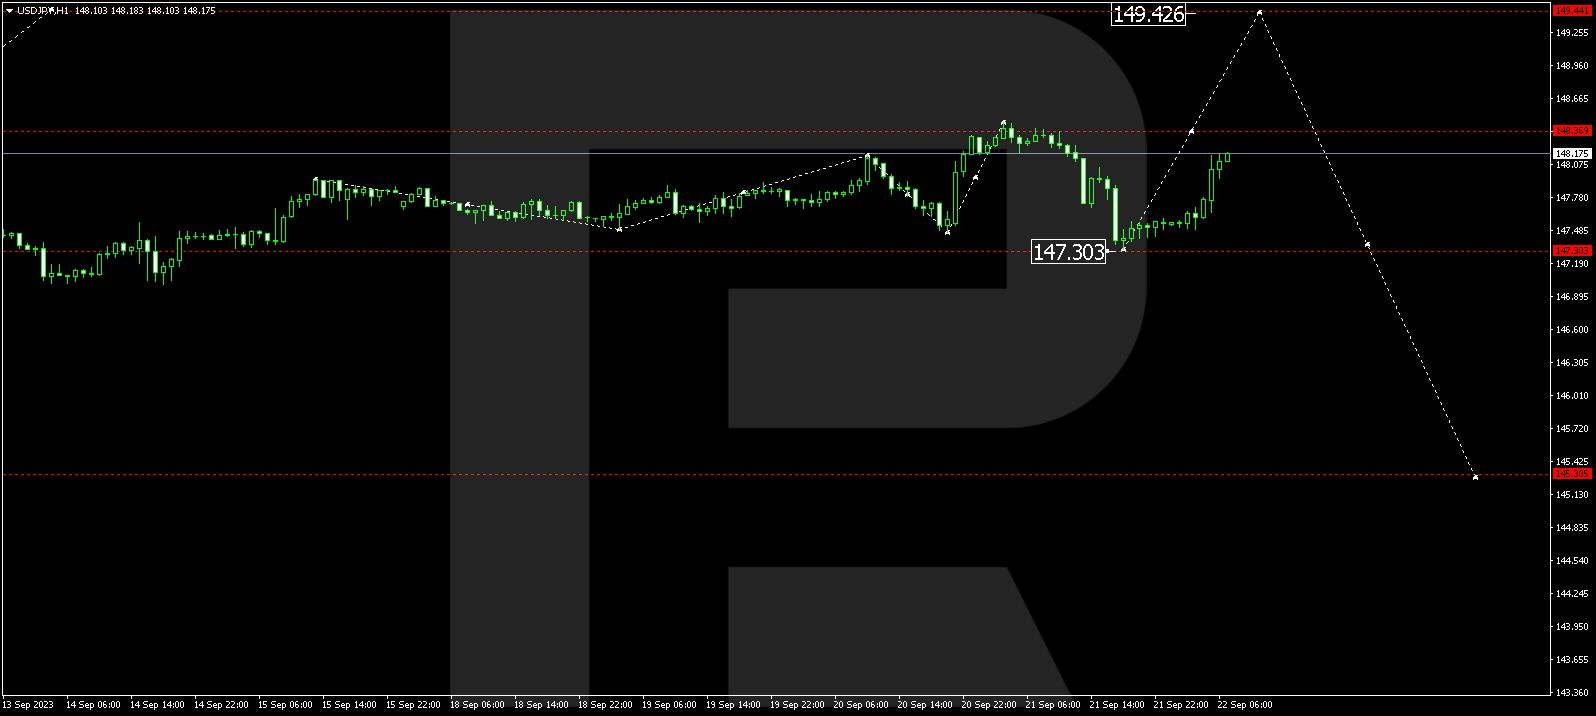
USD/JPY finished a corrective link at 147.31. Today, the market is shaping an upward wave to 148.38. A breakout of this range upwards could open potential for a rise to 149.44, the first target. After reaching this level, a new downward wave to 145.30 might commence.


USD/CHF (US Dollar vs Swiss Franc)
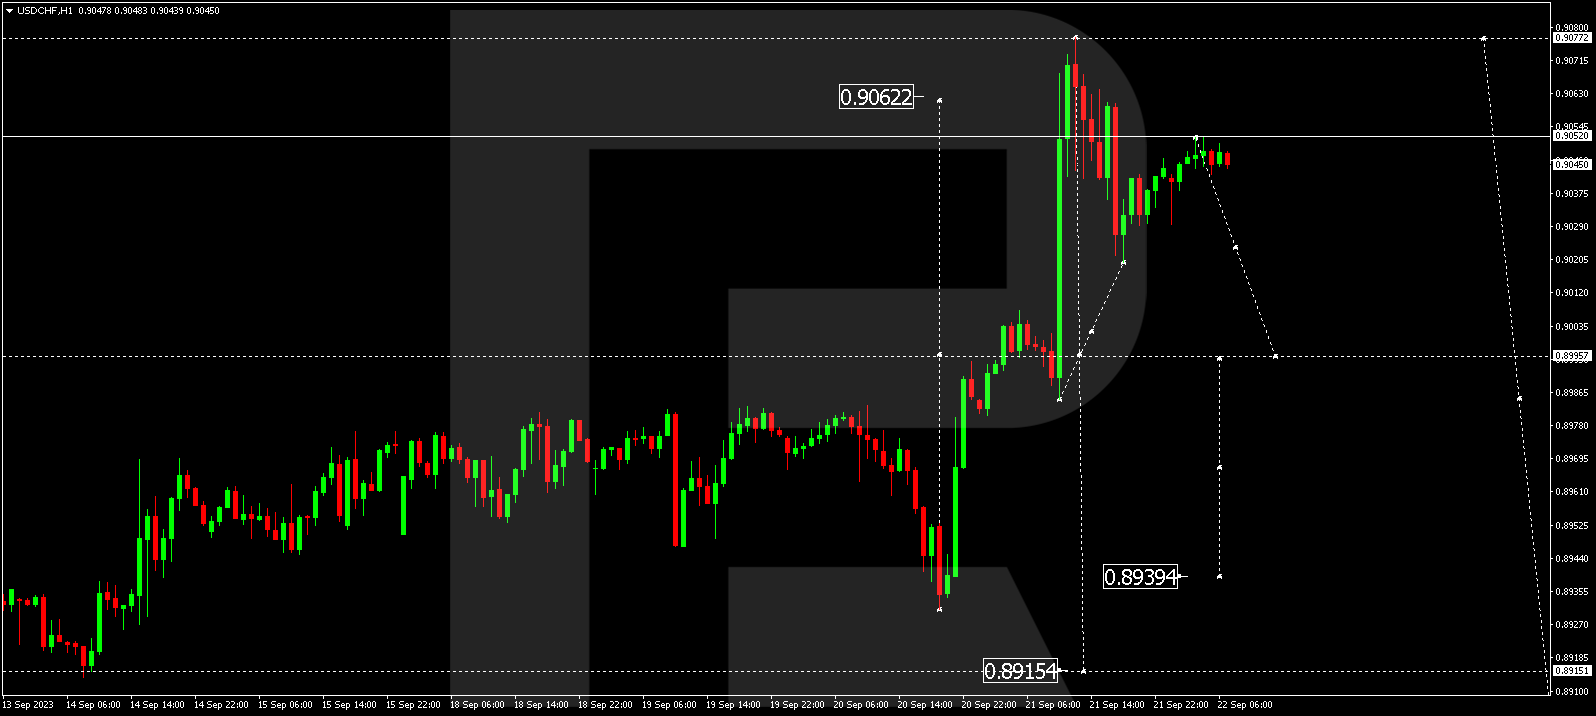
USD/CHF concluded an upward wave to 0.9077. Today, the market corrected to 0.9020 and then rose to 0.9052. A consolidation range has practically formed at these levels. Breaking downwards from this range could introduce potential for a correction to 0.8915. Conversely, an upward breakout might lead to a growth link to 0.9100.
AUD/USD (Australian Dollar vs US Dollar)
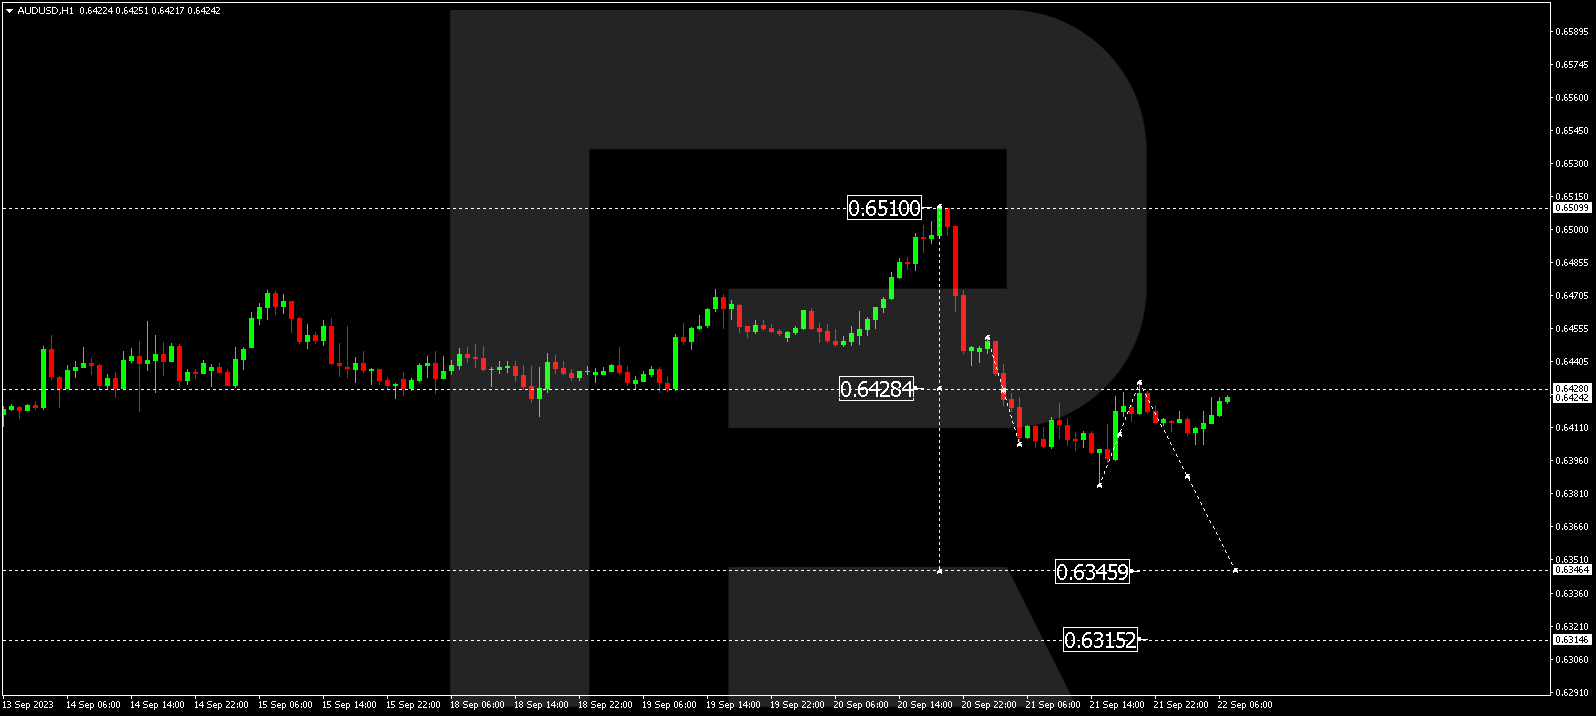
AUD/USD completed a downward impulse to 0.6385. Today, a correction link to 0.6440 could materialize. Following this correction, a new downward wave to 0.6346 might unfold, and from there, the trend could proceed to 0.6315.
BRENT
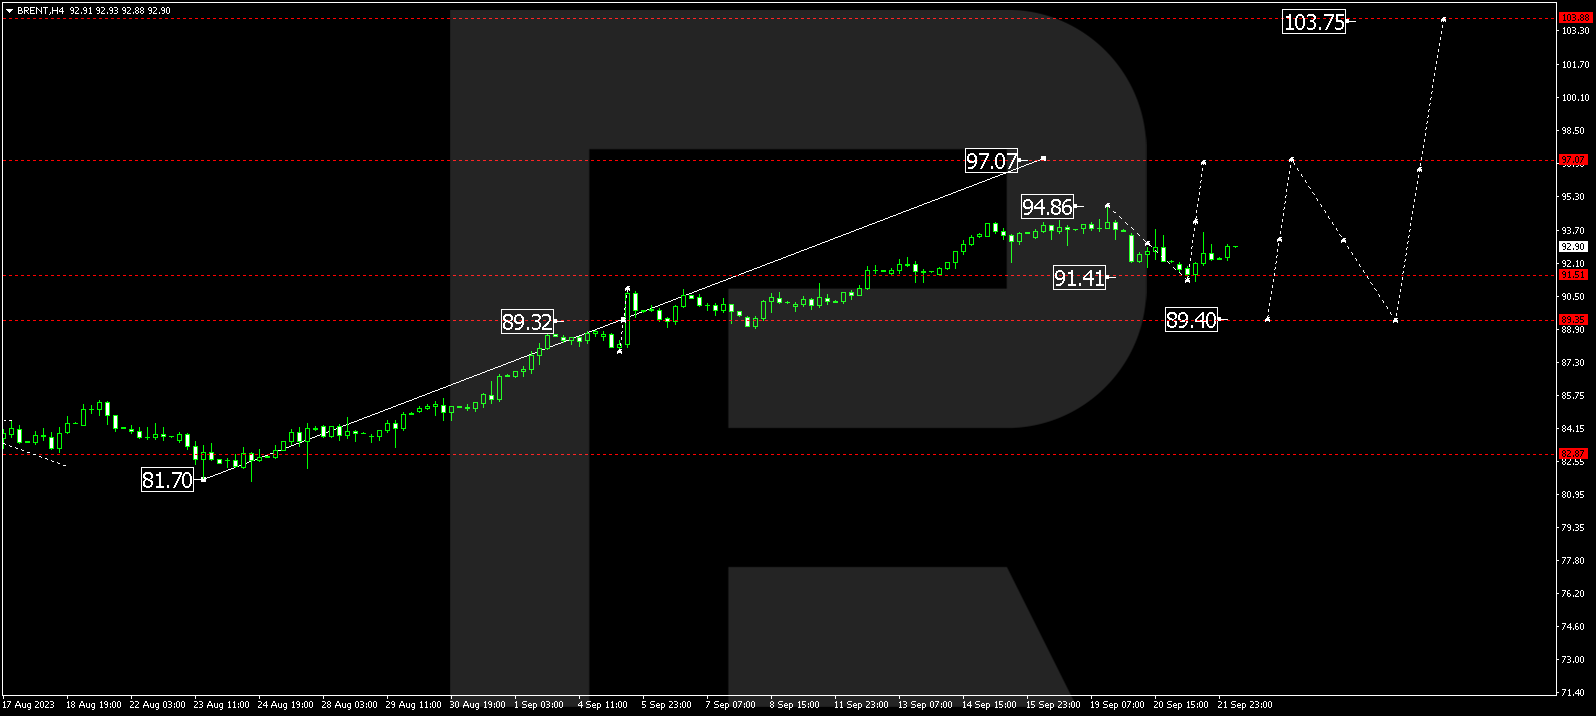
Brent has completed a correction to 91.41. A growth wave to 97.07 might manifest today. After reaching this level, a correction to 89.40 is not excluded, followed by a rise to 103.75, representing a local target.
XAU/USD (Gold vs US Dollar)
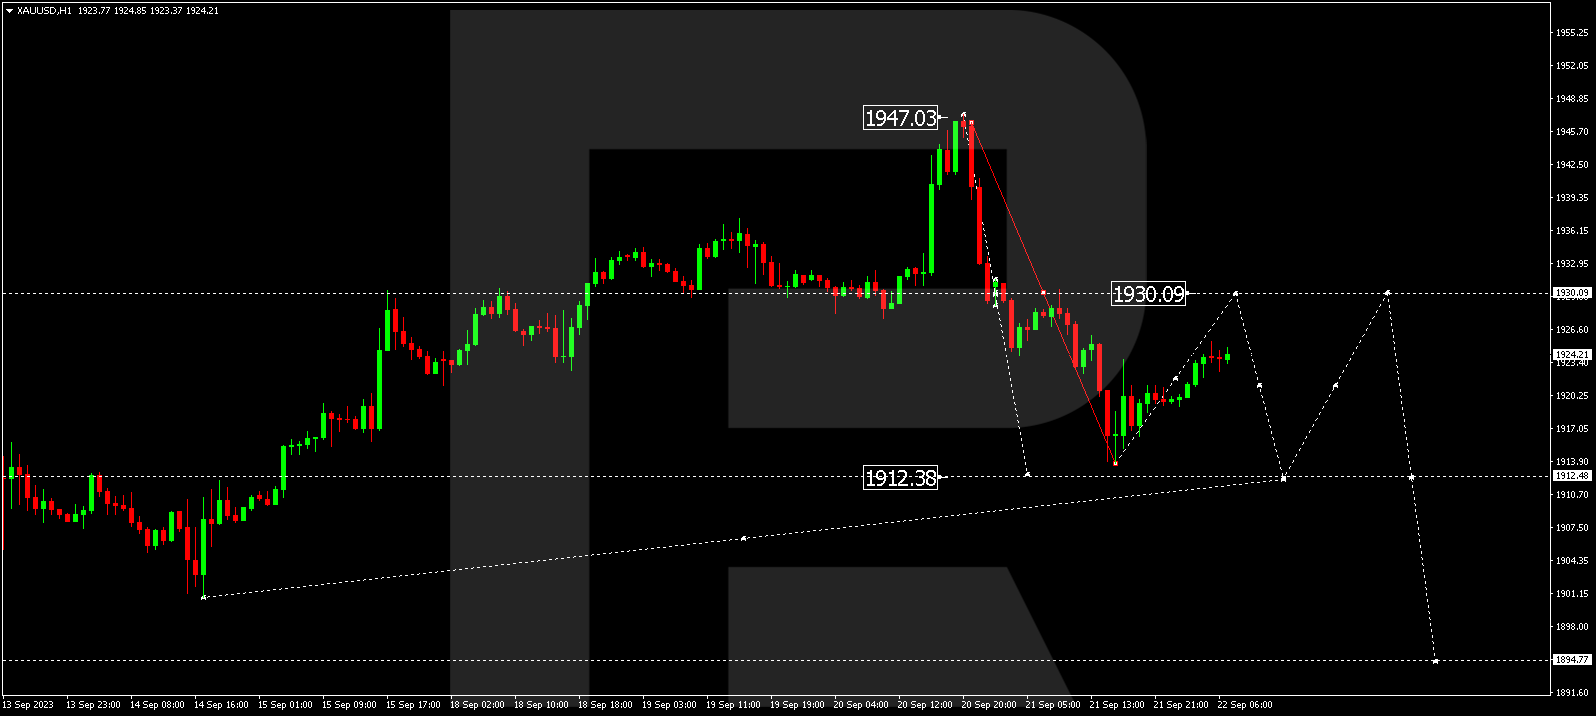
Gold is in the process of developing a downward wave to 1912.48. Following this level, a correction to 1930.09 might emerge. Subsequently, a new downward wave to 1894.77 might commence, representing a local target.
S&P 500
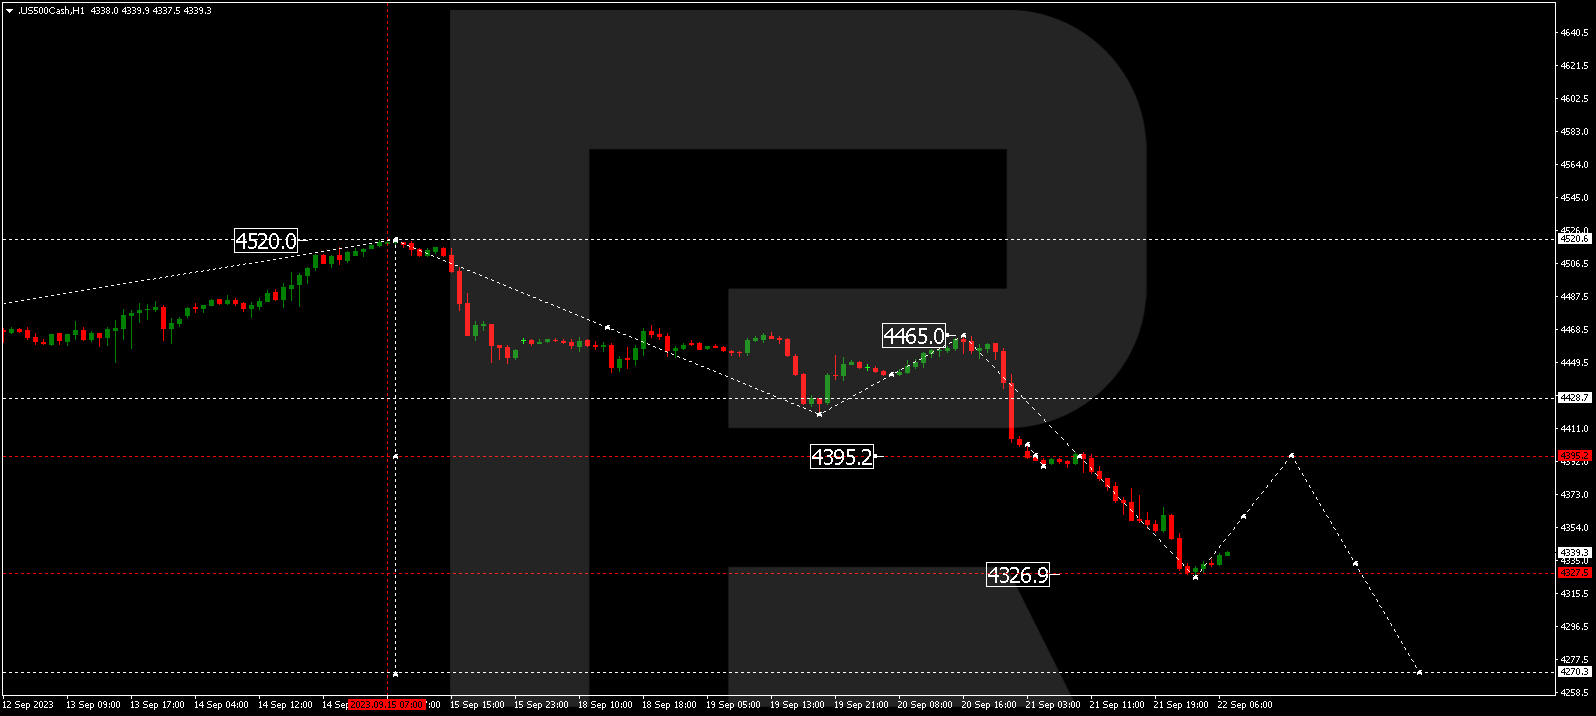
The stock index has concluded a downward wave to 4326.9, constituting a local target. A consolidation range might form above this level today. An upward breakout could lead to a correction link to 4395.2 (with a test from below). Following this, a decline to 4270.3 might follow, representing the first target.
The post Technical Analysis & Forecast September 22, 2023 appeared first at R Blog – RoboForex.