EUR Continues its Descent: This overview also covers the dynamics of GBP, JPY, CHF, AUD, Brent, Gold, and the S&P 500 index.
EUR/USD (Euro vs US Dollar)
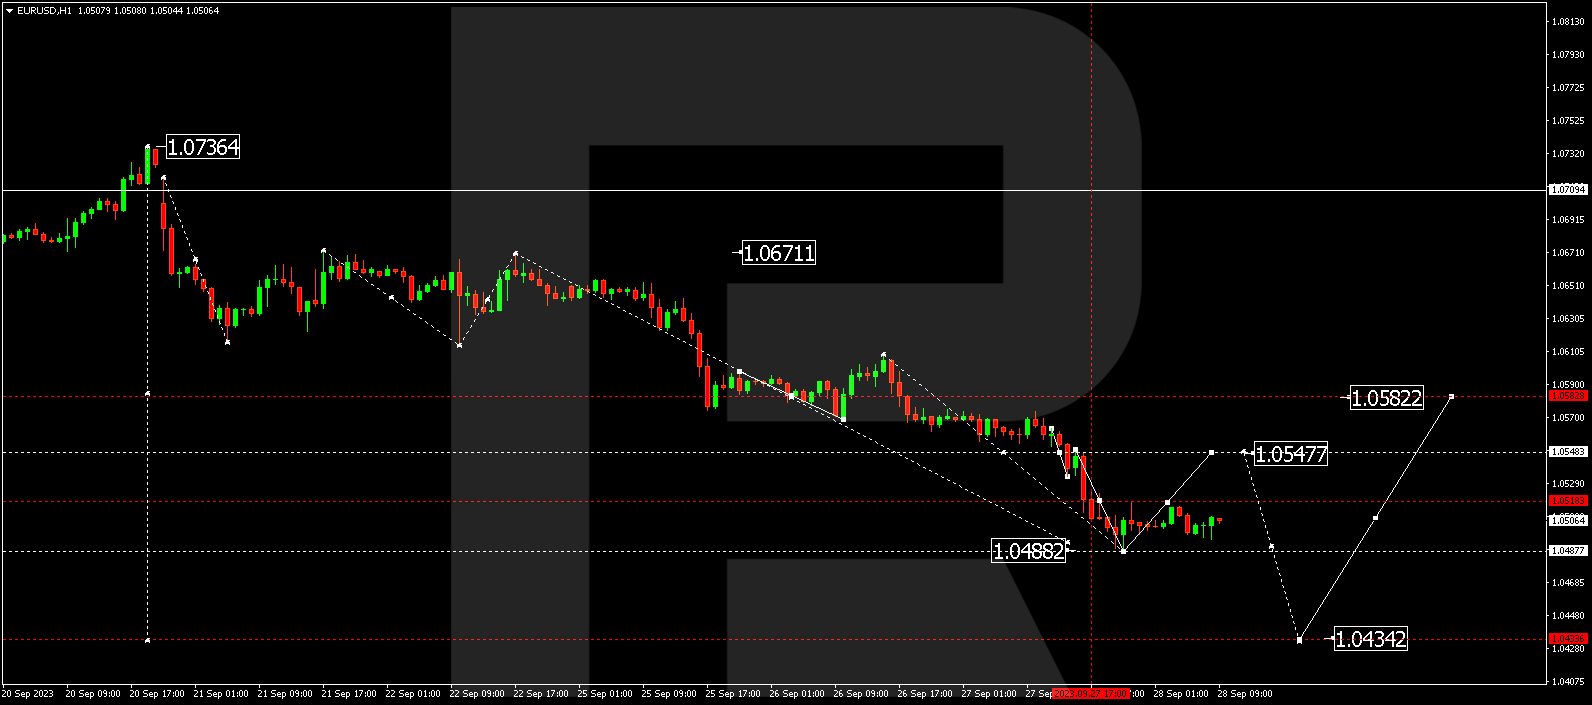
EUR/USD has wrapped up a downward wave, reaching 1.0487. Today, the market is shaping a consolidation range above this level. A downward breakout might set the stage for a movement towards 1.0434. Conversely, an upward breakout could instigate a corrective phase to 1.0545 (a test from below), followed by a decline to 1.0434.
GBP/USD (Great Britain Pound vs US Dollar)
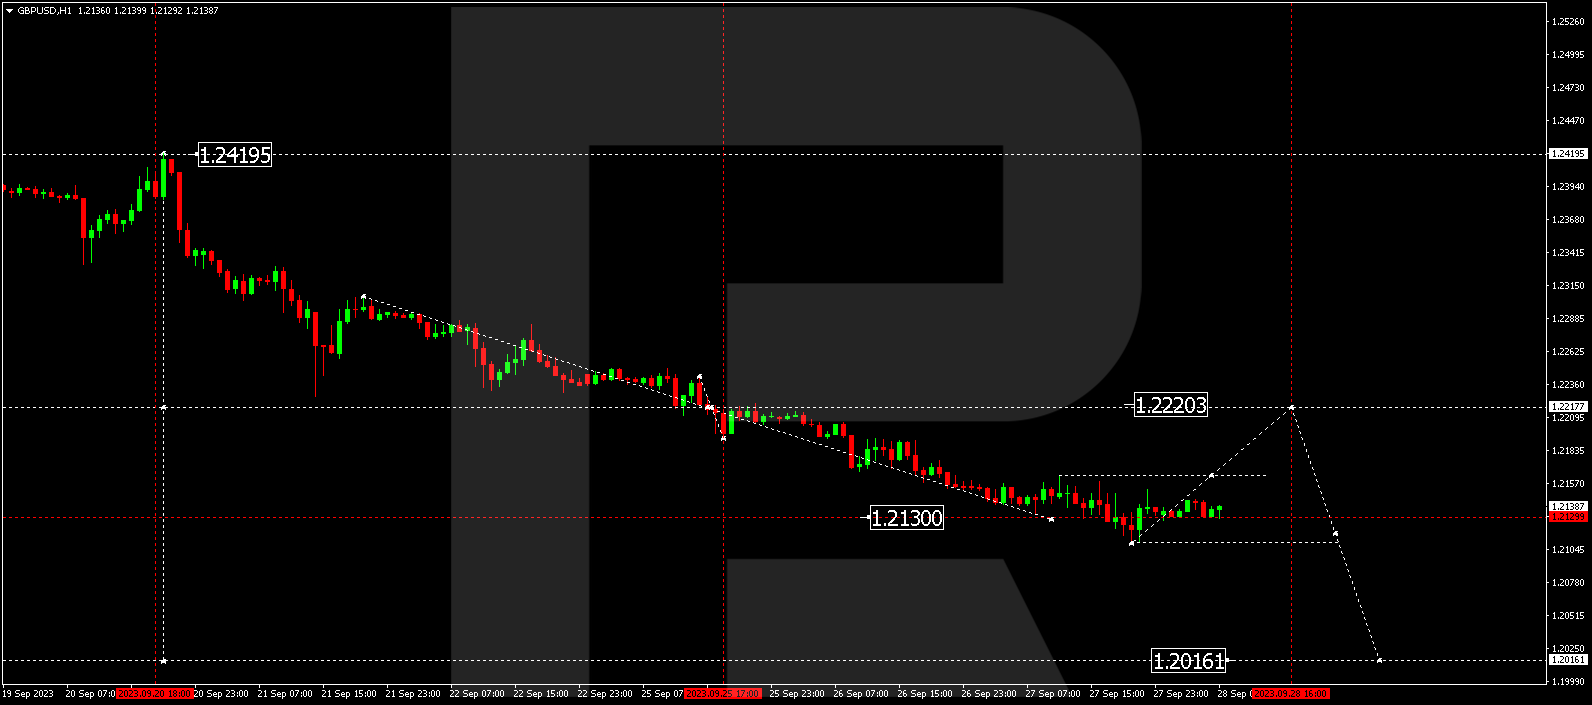
GBP/USD has concluded a downward wave, reaching 1.2110. Today, the market is establishing a consolidation range above this level. Should a downward breakout occur, it could pave the way for a movement towards 1.2016. Conversely, an upward breakout might trigger a corrective phase to 1.2220 (a test from below), followed by a decline to 1.2016.
USD/JPY (US Dollar vs Japanese Yen)
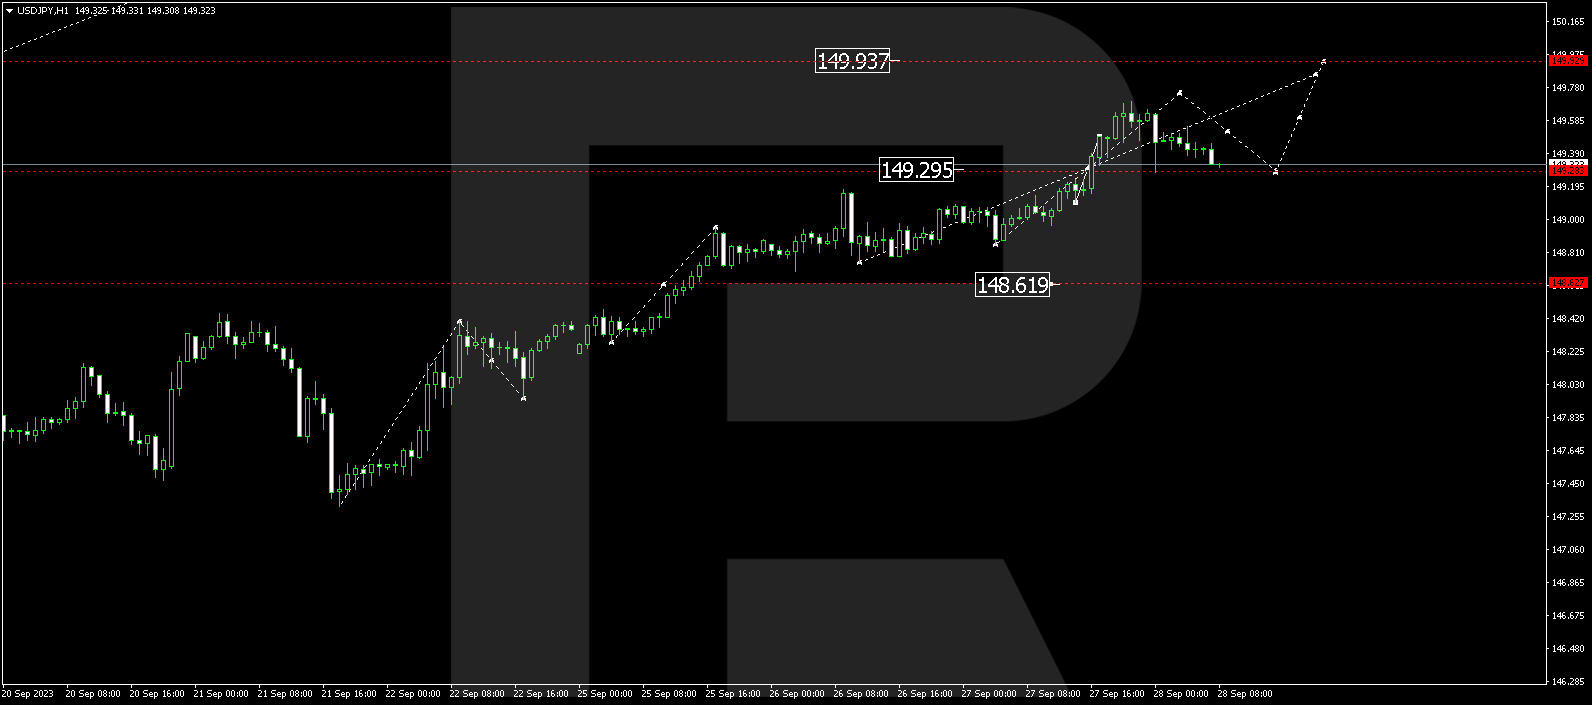
USD/JPY has completed its upward movement to 149.69, and the market is currently correcting to 149.28. A continued growth wave could take it to 149.93. Subsequently, a correction to 148.62 might commence once the price hits this level.


USD/CHF (US Dollar vs Swiss Franc)
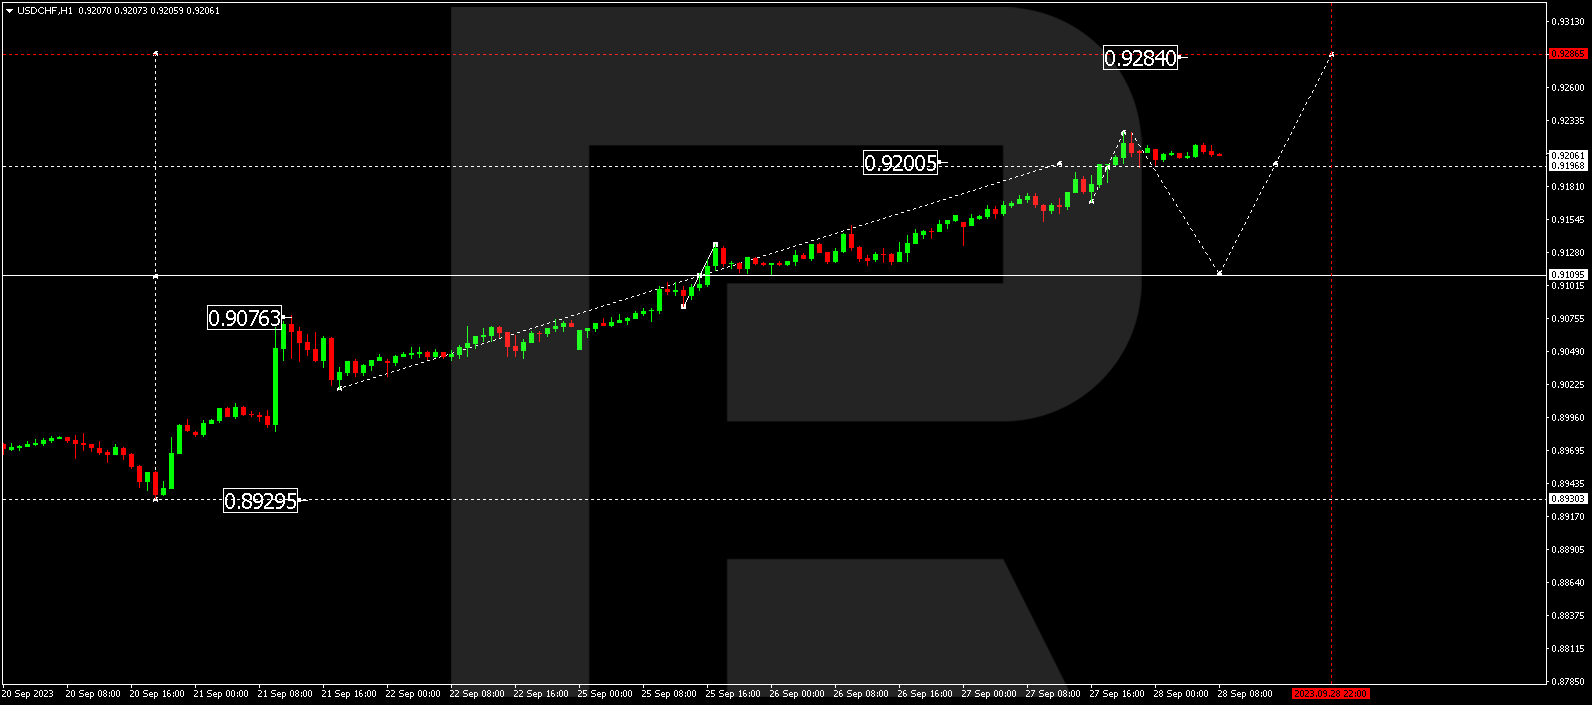
USD/CHF has concluded a growth wave, reaching 0.9224. Today, the market is advancing a consolidation range below this level. A downward breakout could lead to a correction to 0.9110. Conversely, an upward breakout might sustain the trend towards 0.9284.
AUD/USD (Australian Dollar vs US Dollar)
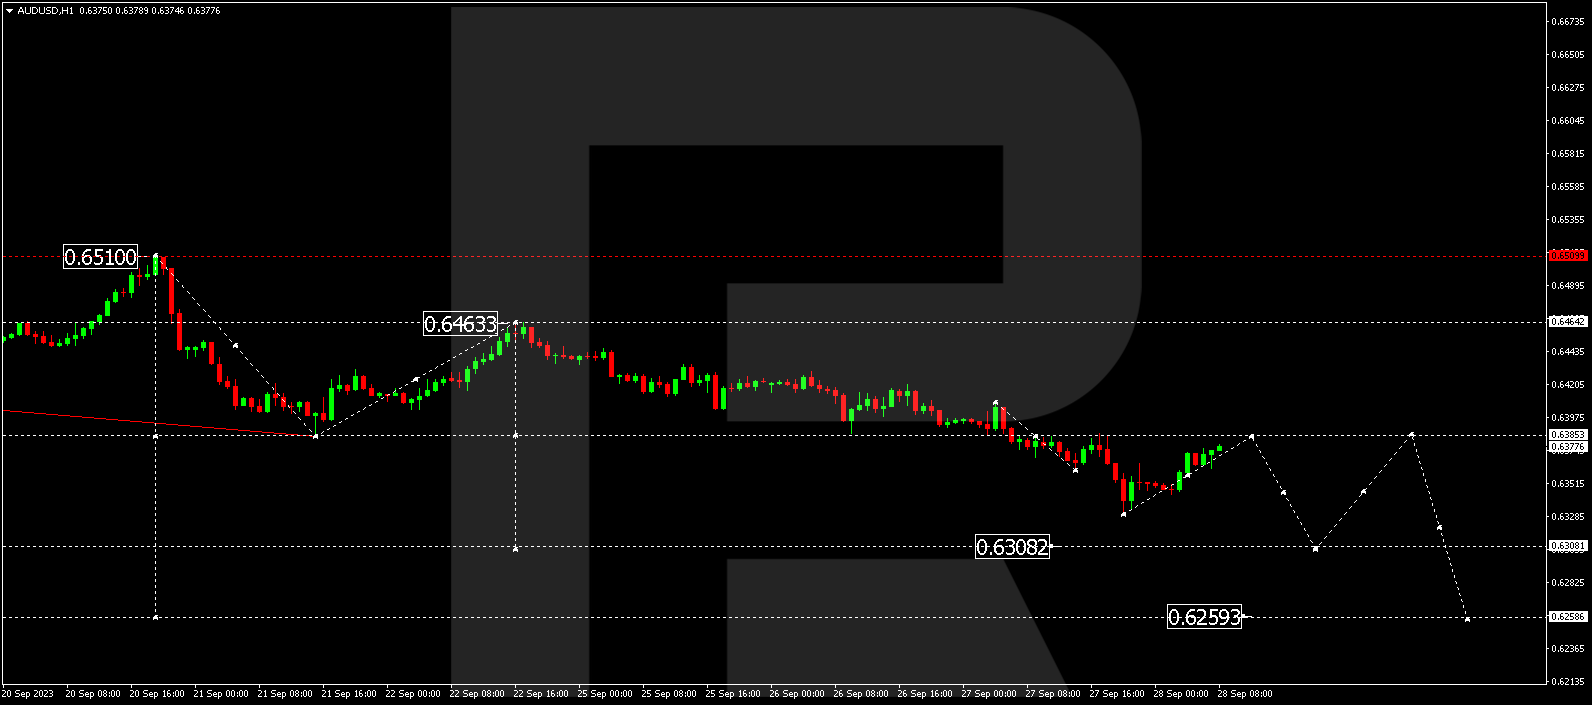
AUD/USD has concluded its downward movement, reaching 0.6330. The market is now forming a correction to 0.6385. Following this correction, a decline wave to 0.6308 might develop, potentially paving the way for the trend to extend to 0.6260.
BRENT
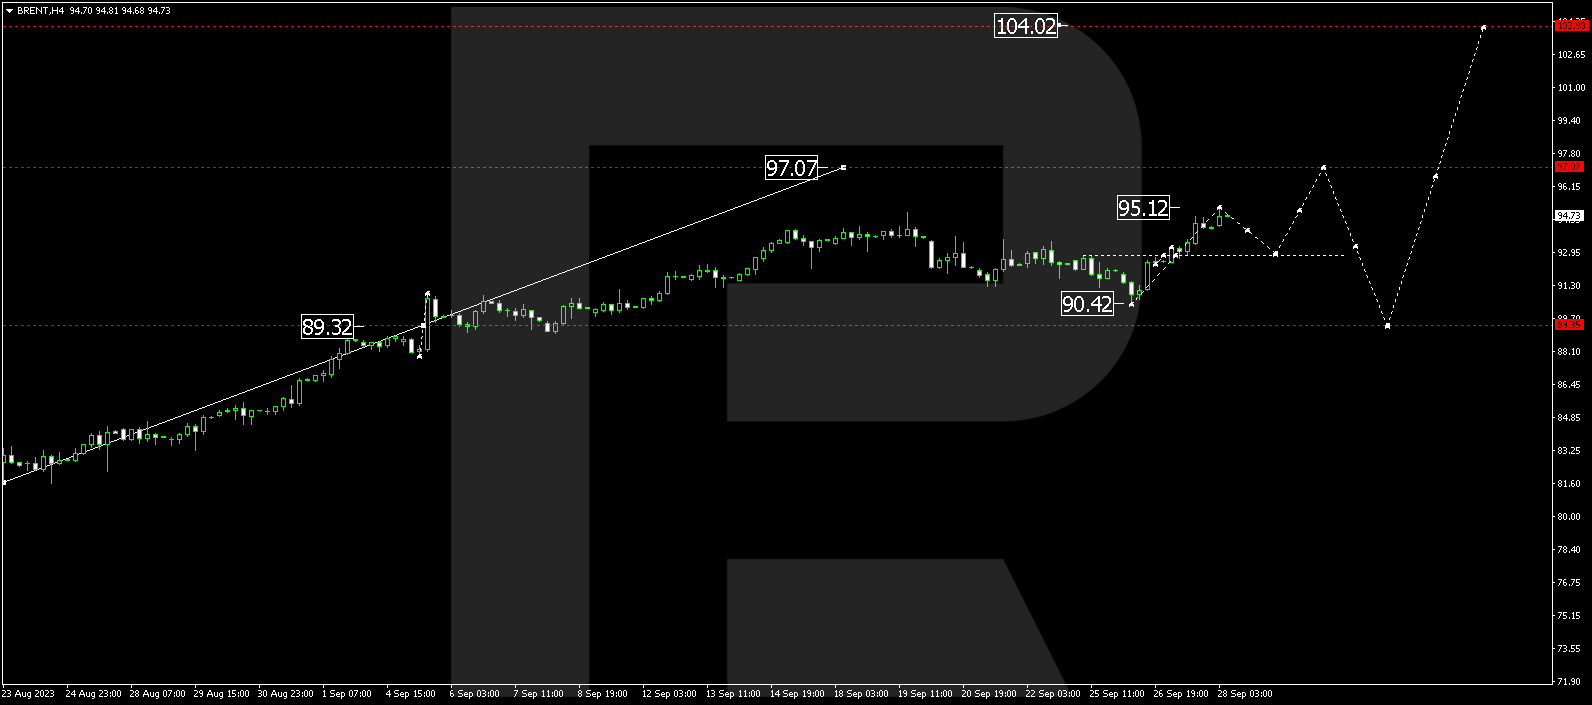
Brent has wrapped up its upward movement, hitting 95.12. Today, a corrective link to 92.85 could potentially follow. Following this, the trend might advance to 97.07, potentially expanding to 104.00. This represents a local target.
XAU/USD (Gold vs US Dollar)
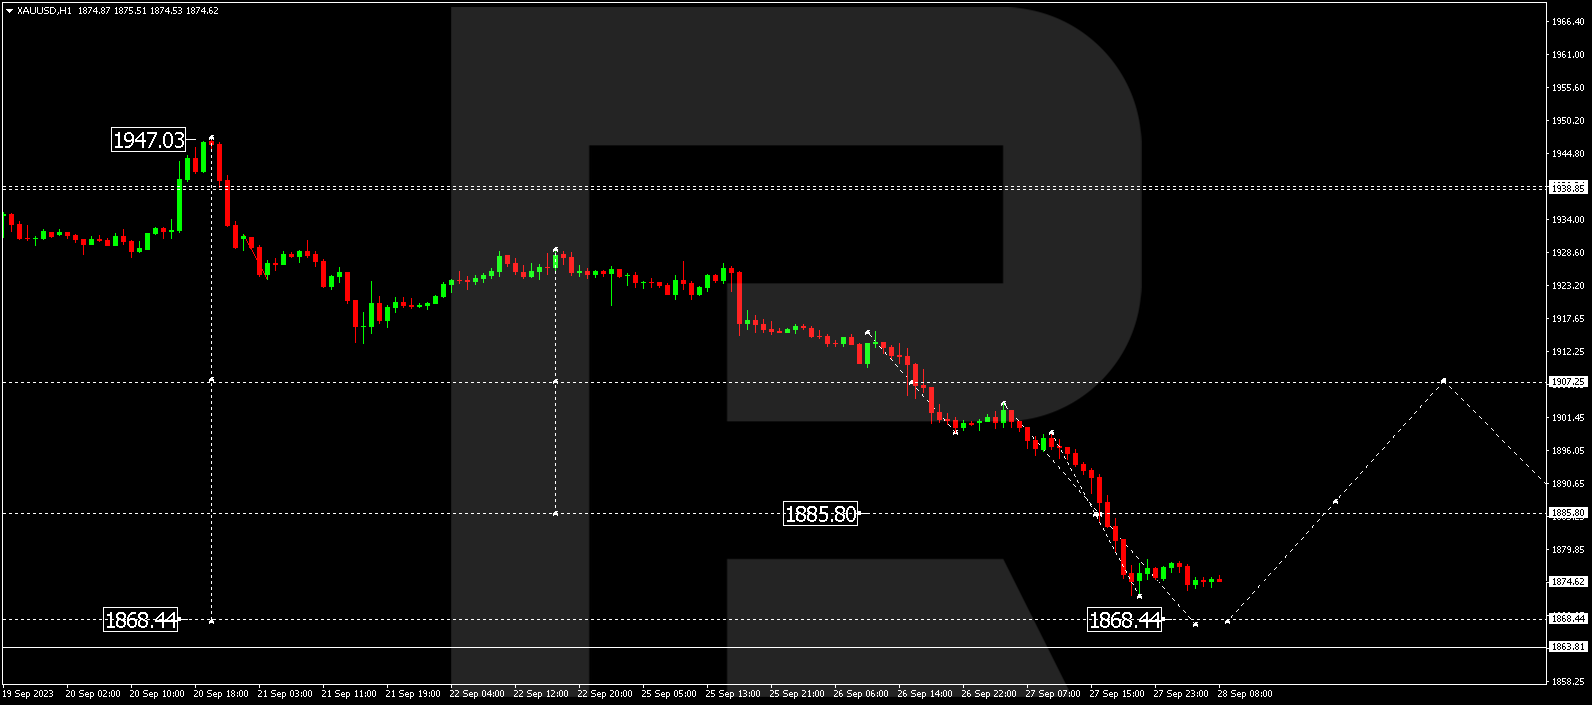
Gold has concluded a decline wave, reaching 1872.20. Today, the market is establishing a consolidation range above this level. A downward breakout might lead to a decline to 1868.44. Conversely, an upward breakout could instigate a correction to 1885.80 (a test from below), followed by a fall to 1868.44.
S&P 500
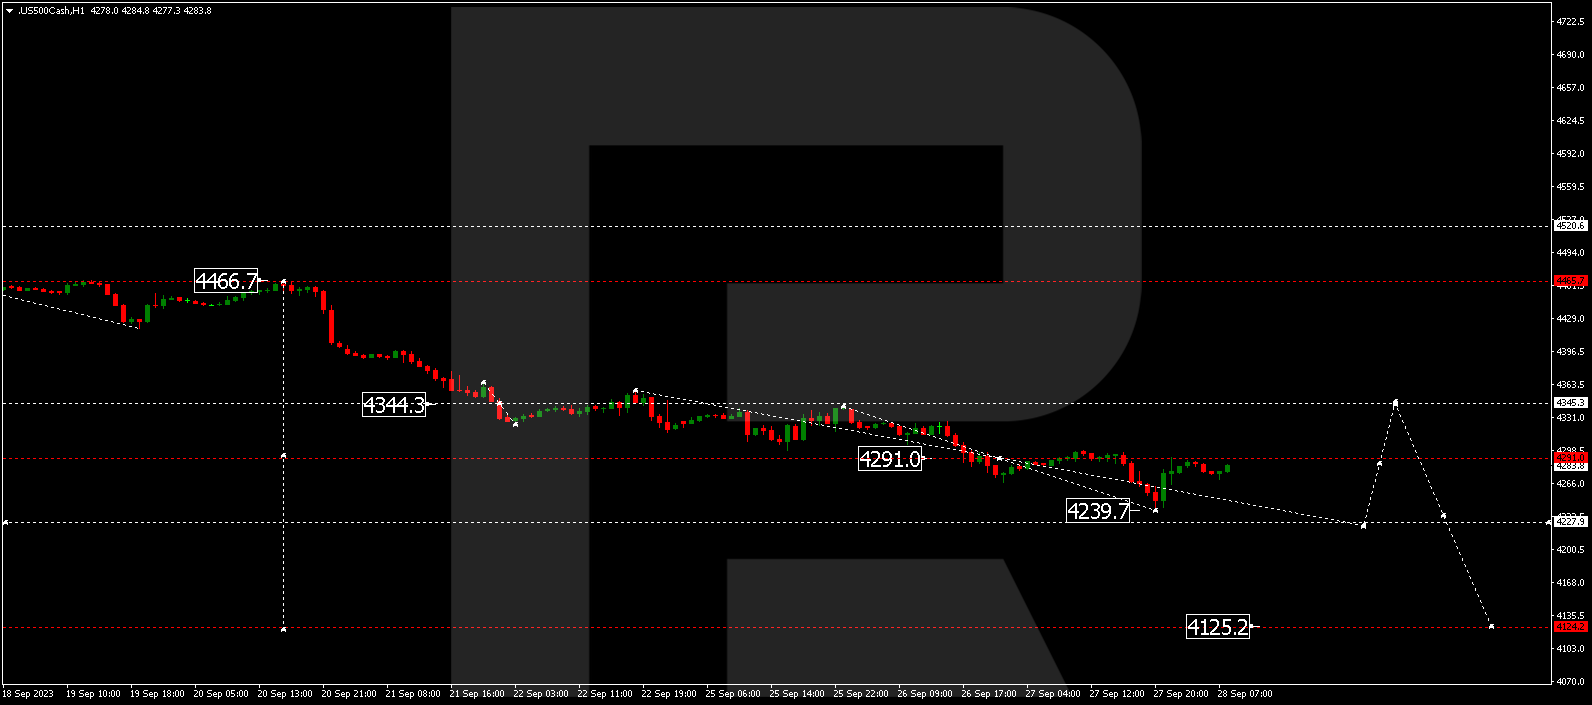
The stock index has completed its downward movement, reaching 4239.7, with the market currently in correction at 4291.0. Following the conclusion of this correction, a decline wave to 4228.0 could commence, potentially setting the stage for the trend to extend to 4125.2.
The post Technical Analysis & Forecast September 28, 2023 appeared first at R Blog – RoboForex.