
S&P 500 Index Poised for a Possible Correction: This overview also encompasses the dynamics of EUR, GBP, JPY, CHF, AUD, Brent, and Gold.
EUR/USD (Euro vs US Dollar)
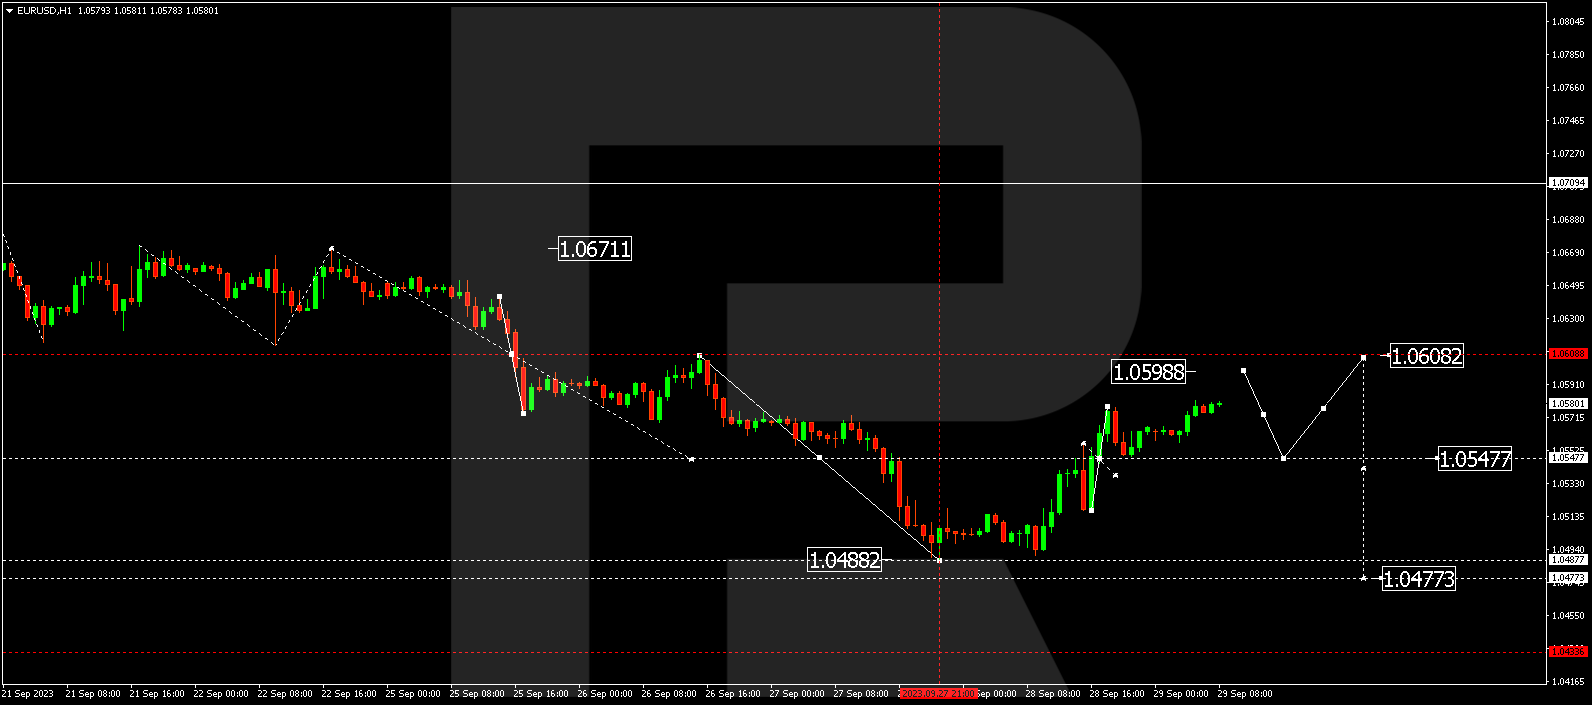
EUR/USD has exhibited a growth movement, reaching 1.0545. Presently, the market is establishing a consolidation range above this level. Breaking below this range could potentially initiate a wave towards 1.0477. Conversely, an upward breakout might not exclude a corrective phase to 1.0600 (with a test from below), followed by a decline to 1.0477.
GBP/USD (Great Britain Pound vs US Dollar)
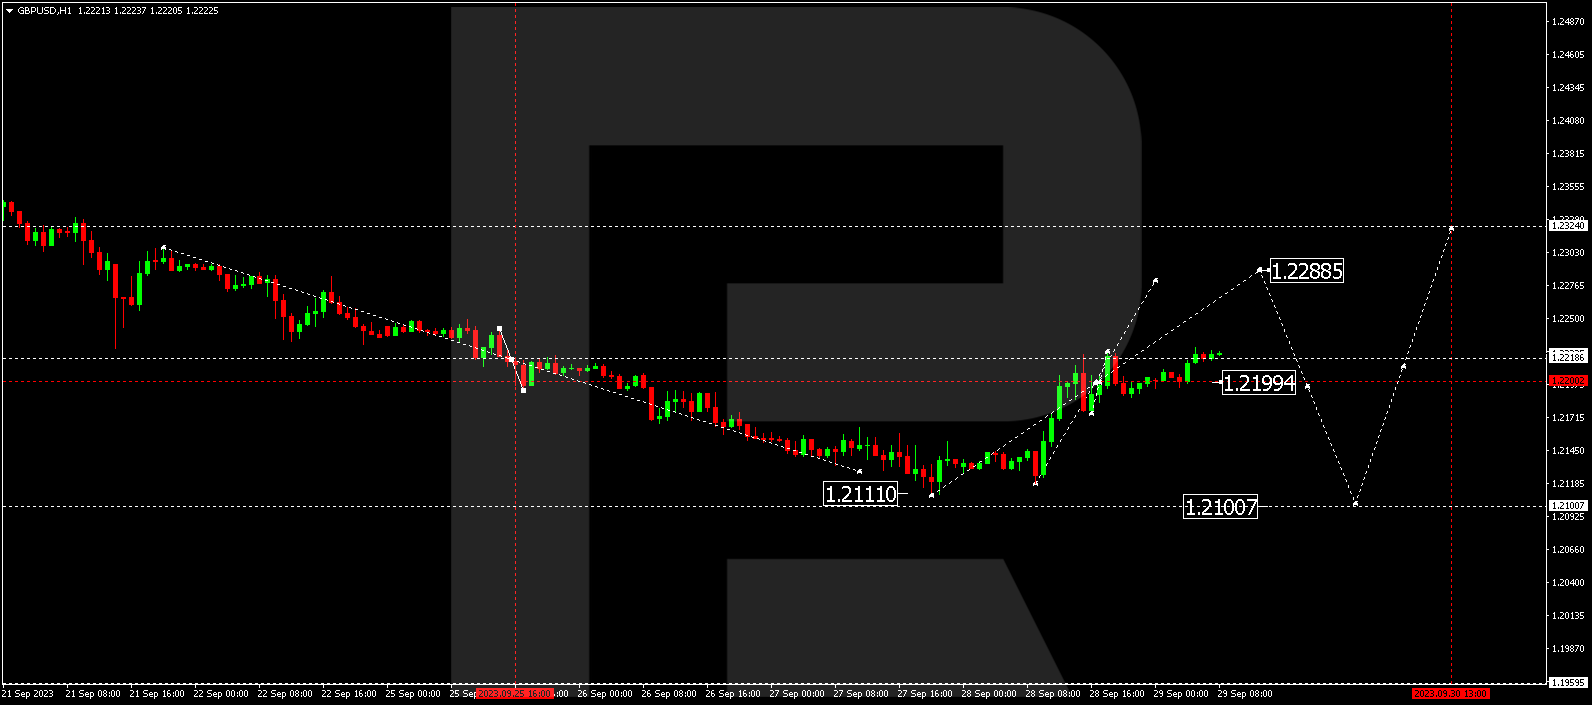
GBP/USD has experienced a growth movement to 1.2199. Currently, the market is forming a consolidation range above this level. Breaking below this range could potentially trigger a wave towards 1.2100. Conversely, an upward breakout might not exclude a corrective phase to 1.2288 (with a test from below), followed by a decline to 1.2100.
USD/JPY (US Dollar vs Japanese Yen)
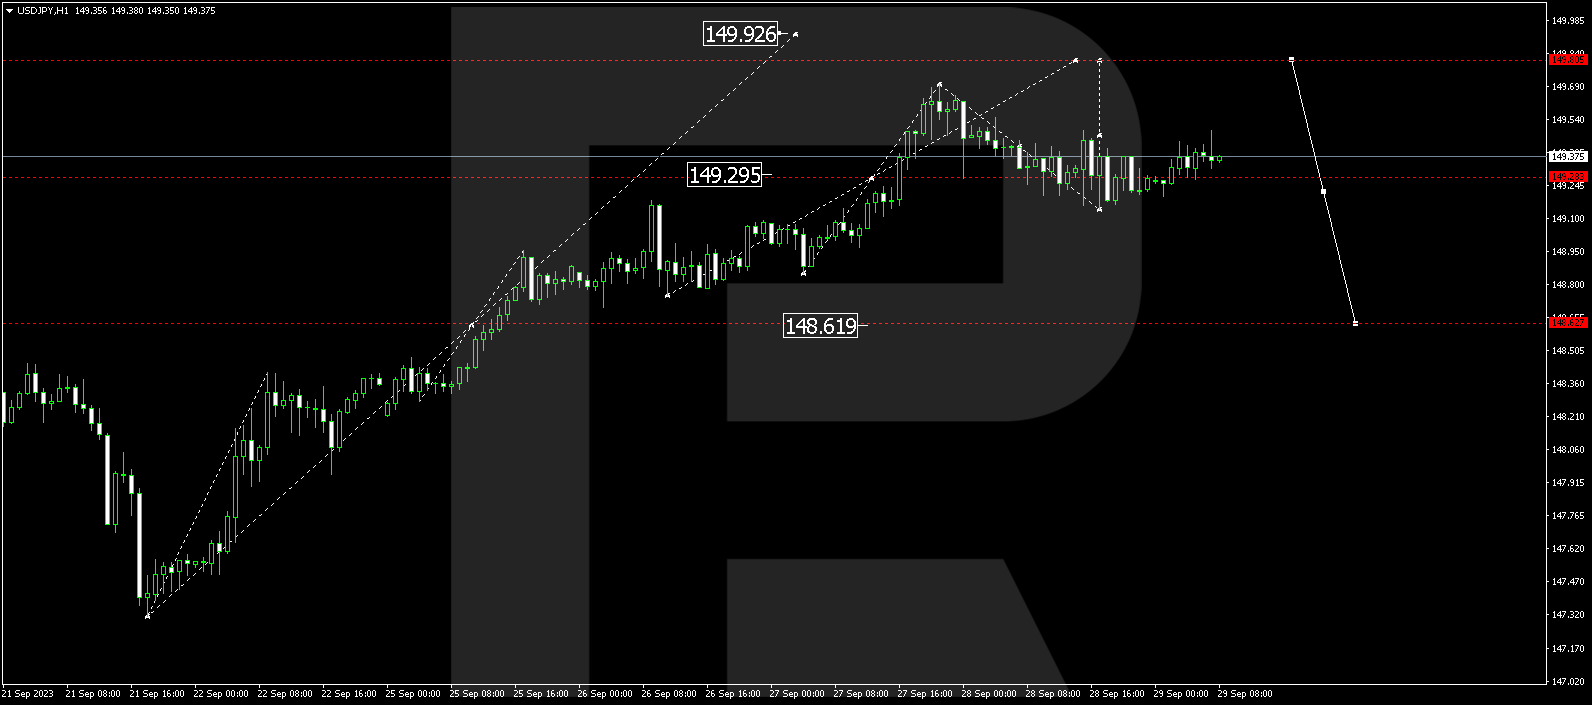
USD/JPY is establishing a consolidation range around 149.28. A downward breakout from this range could potentially extend the correction to 148.62. Conversely, an upward breakout might sustain the trend towards 149.88.


USD/CHF (US Dollar vs Swiss Franc)
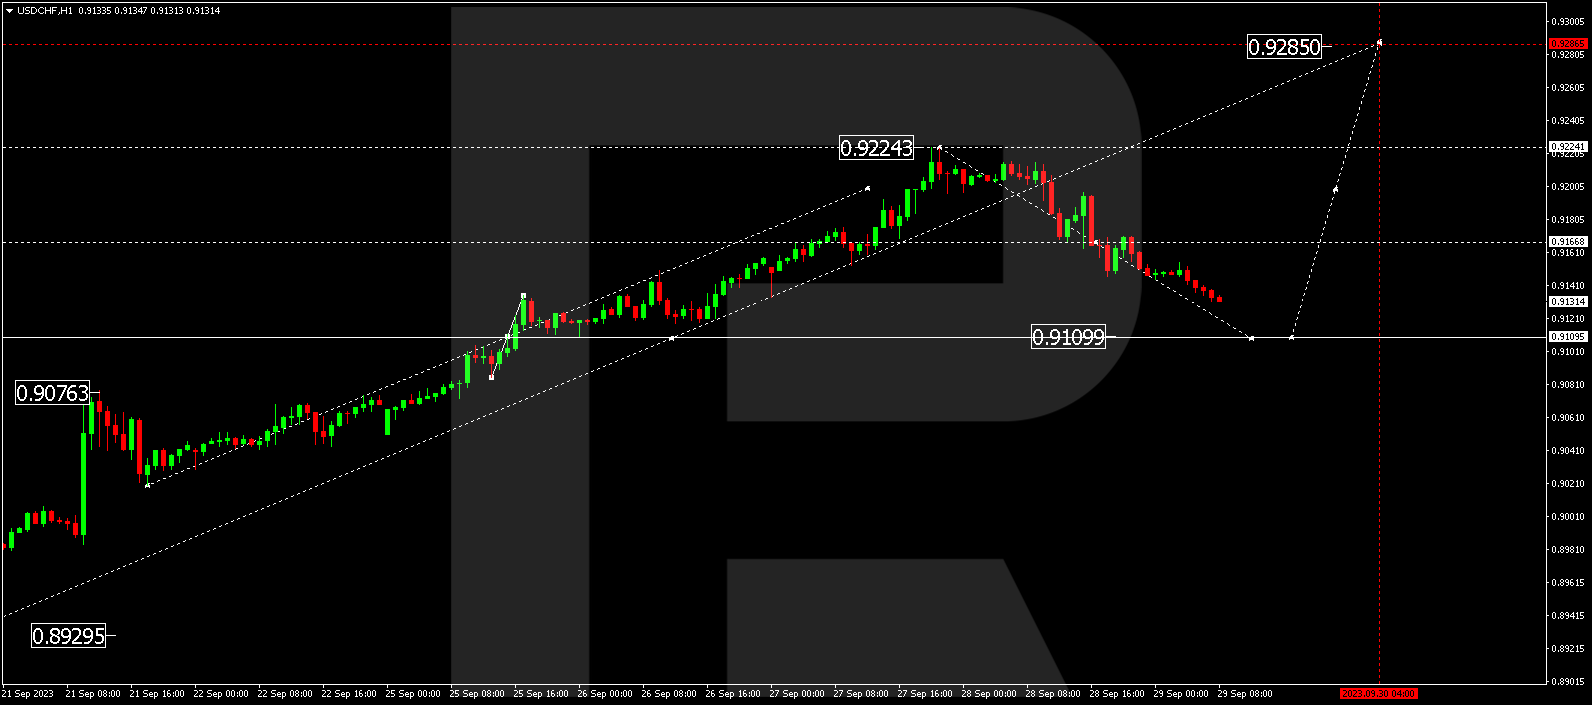
USD/CHF has completed a corrective wave to 0.9166. Presently, the market has structured a consolidation range around this level. A downward breakout from this range could potentially lead to a correction to 0.9110. Once the correction concludes, the trend might continue towards 0.9285.
AUD/USD (Australian Dollar vs US Dollar)
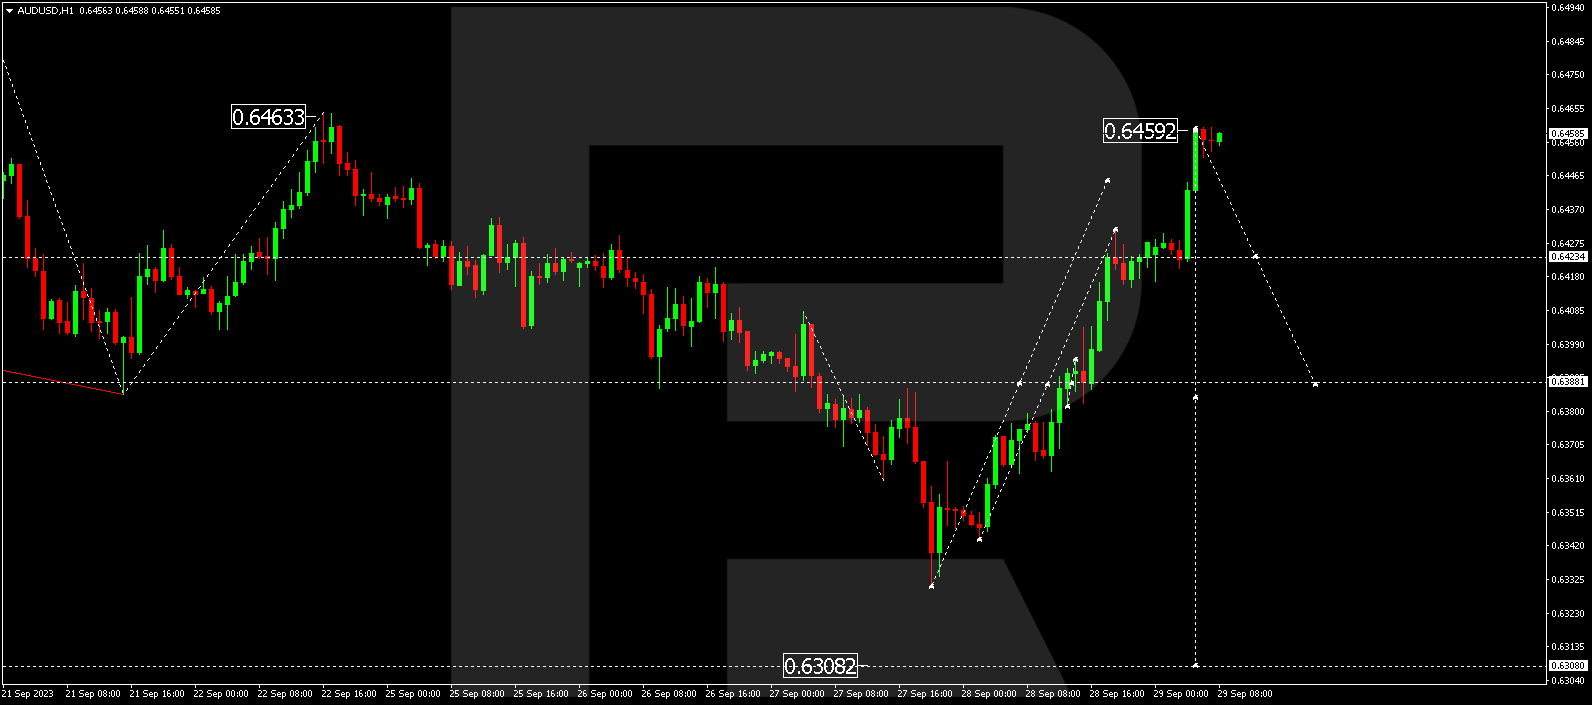
AUD/USD has undergone a corrective wave to 0.6460. Currently, the market is forming a consolidation range below this level. A downward breakout from this range could potentially result in a decline to 0.6388. Alternatively, breaking above this level might open the potential for a trend-driven decline to 0.6300.
BRENT
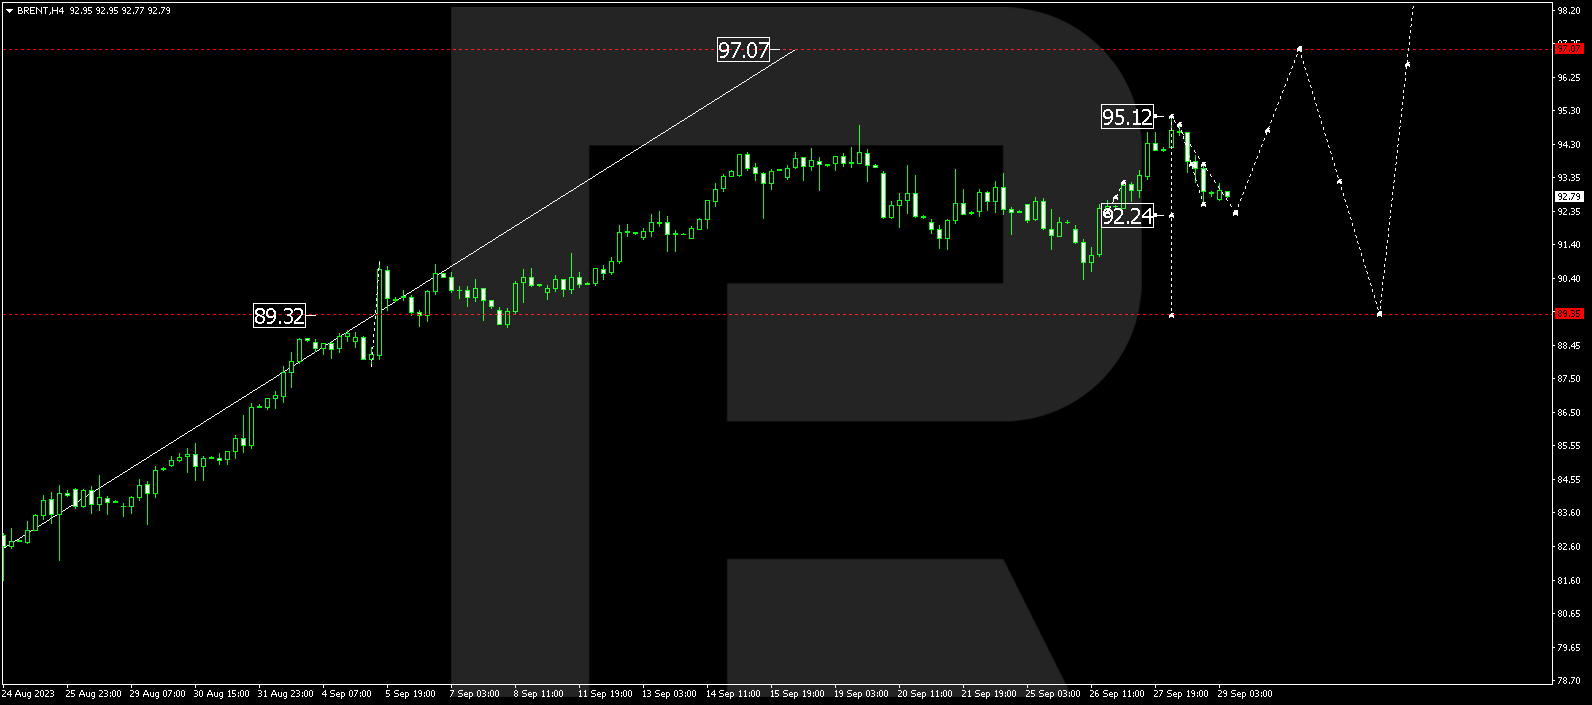
Brent has experienced an upward wave to 95.12. Today, the market is undergoing a correction to 92.24. Following this, a potential upward breakout to 93.73 might occur. This will help in establishing the new boundaries of the market range. A downward breakout could extend the correction to 89.35. Conversely, an upward breakout could open the potential for a continued rise in line with the trend, reaching 97.07. This represents a local target.
XAU/USD (Gold vs US Dollar)
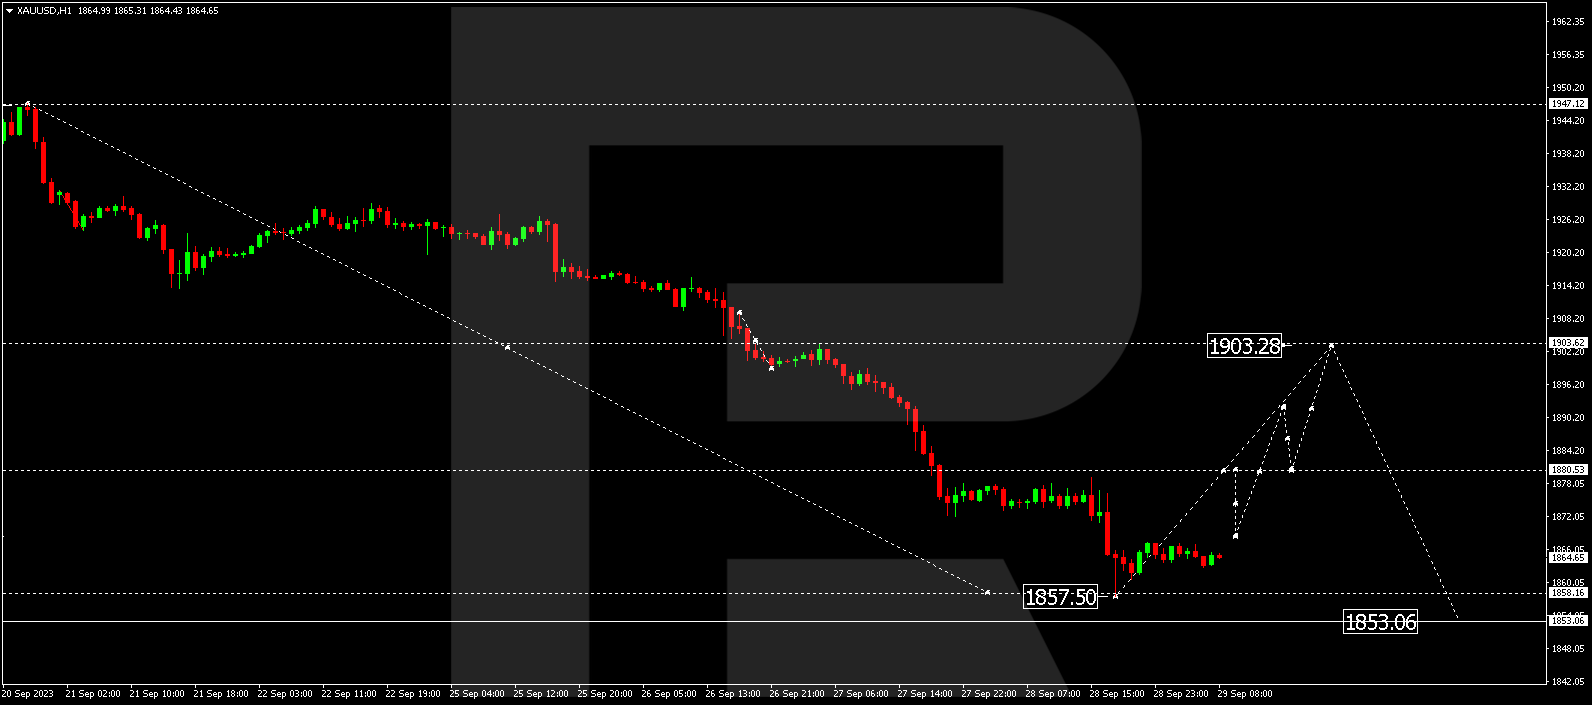
Gold has completed a decline wave to 1857.50. Presently, the market is establishing a consolidation range above this level. A downward breakout from this range could potentially lead to a decline to 1853.05. Conversely, breaking above this level might not exclude a corrective phase to 1880.80 (with a test from below), followed by a decline to 1853.05.
S&P 500
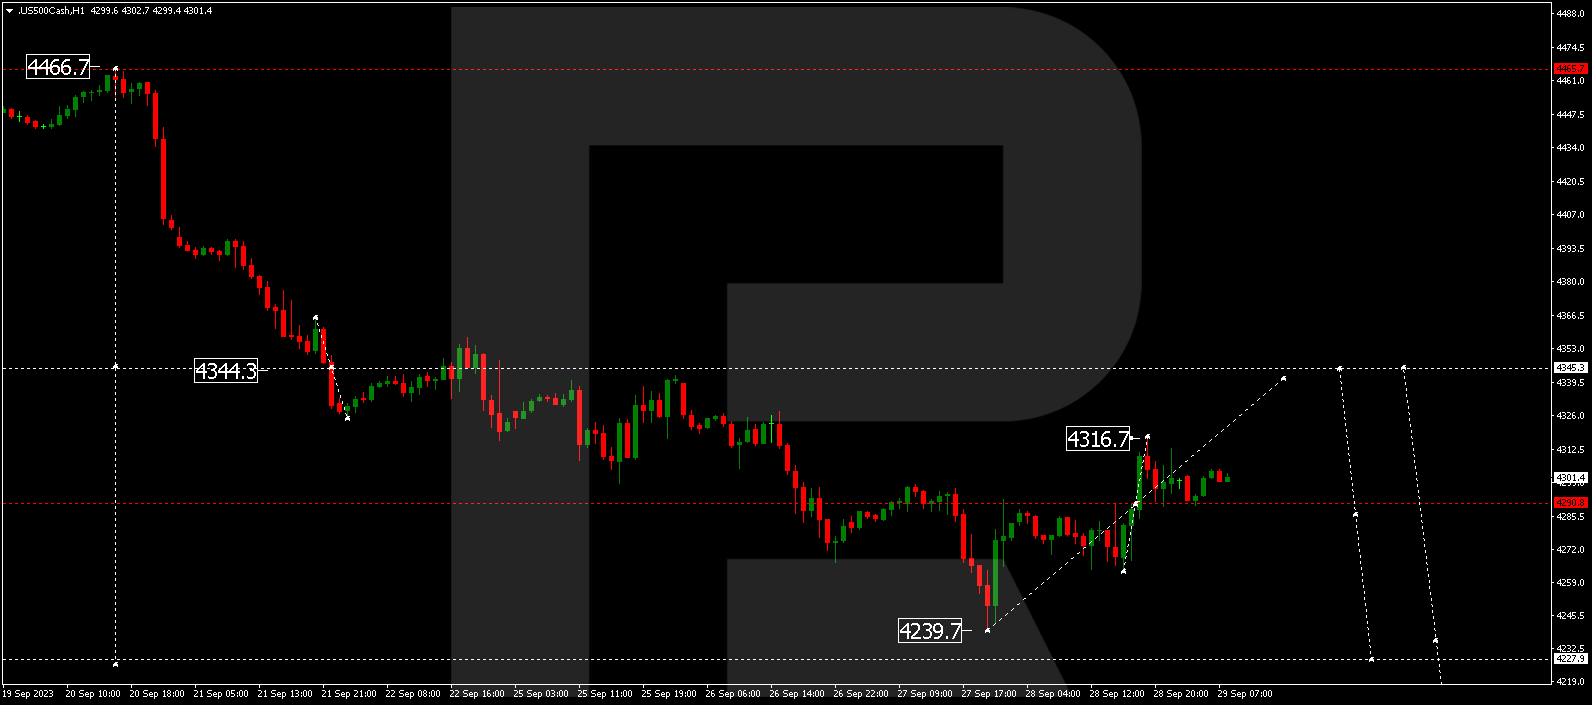
The stock index has experienced a rise to 4290.0. Today, the market is in a consolidation phase around this level. An upward breakout from this range could potentially extend the correction to 4345.3. Following this, a decline wave to 4228.0 might commence.
The post Technical Analysis & Forecast September 29, 2023 appeared first at R Blog – RoboForex.